
All data for this account is guaranteed by the website
Teilen mit ...
Link kopieren
stfuandkissmewhore *********ssmewhore | 66.8K followers instagram account
95 months aged
@*********ssmewhore

Posts
294

Followers
66.8K
Following
8


Datum des Beitritts
Apr. 2018

Datum der ersten Veröffentlichung
01.05.2018

Datum des letzten Beitrags
23.03.2026
All (Last 3 Months)

1.2M
12.8M
745
429.3K
70.7K
Averages
13.5K
143.2K
8
4.7K
786
Engagement over time
Likes
Kommentare
Video-Foto-Verhältnis
Bilder
Videos
Beitrag/pro Monat
Besties

Am meisten gefallen
170K
Meistkommentiert
148
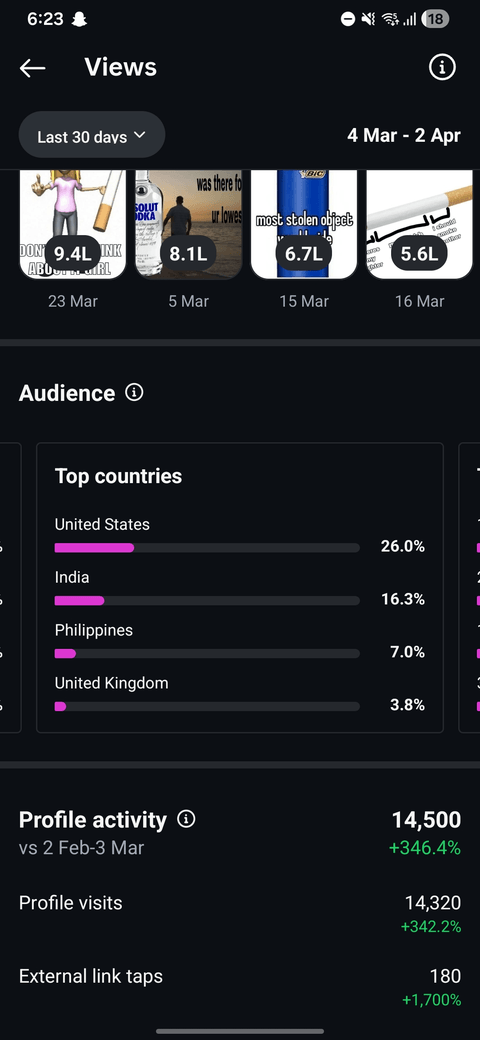
Top Countries
United States
41.9%
India
8.0%
United Kingdom
6.6%
Poland
4.3%
Canada
3.2%
Italy
2.7%
Germany
2.3%
Australia
2.0%
Pakistan
1.8%
Brazil
1.6%
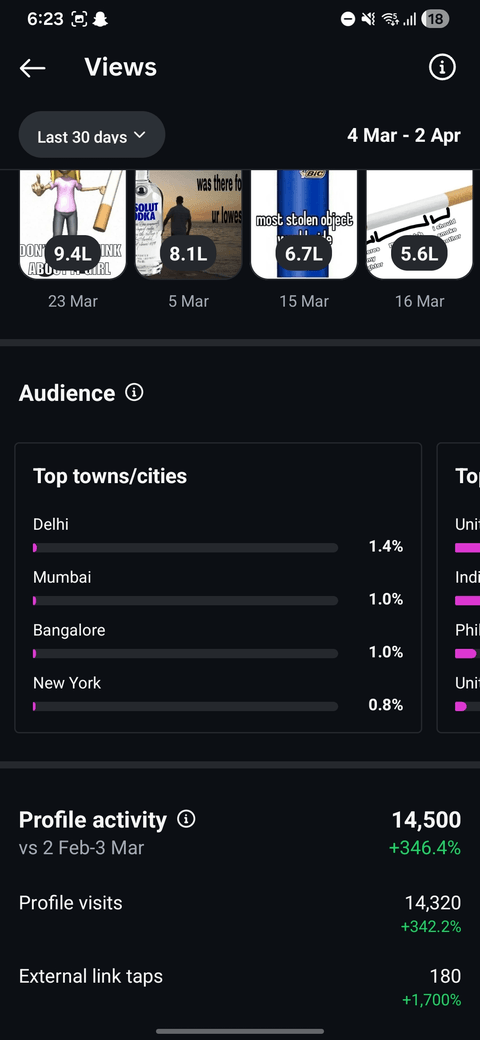
Top Cities
New York New York
7.7%
Delhi Delhi
5.8%
Mumbai Maharashtra
4.5%
Dhaka Dhaka Division
4.2%
Karachi Sindh
3.6%
Bangalore Karnataka
3.2%
London England
3.2%
Los Angeles California
3.0%
Warsaw Masovian Voivodeship
3.0%
Singapore Singapore
3.0%
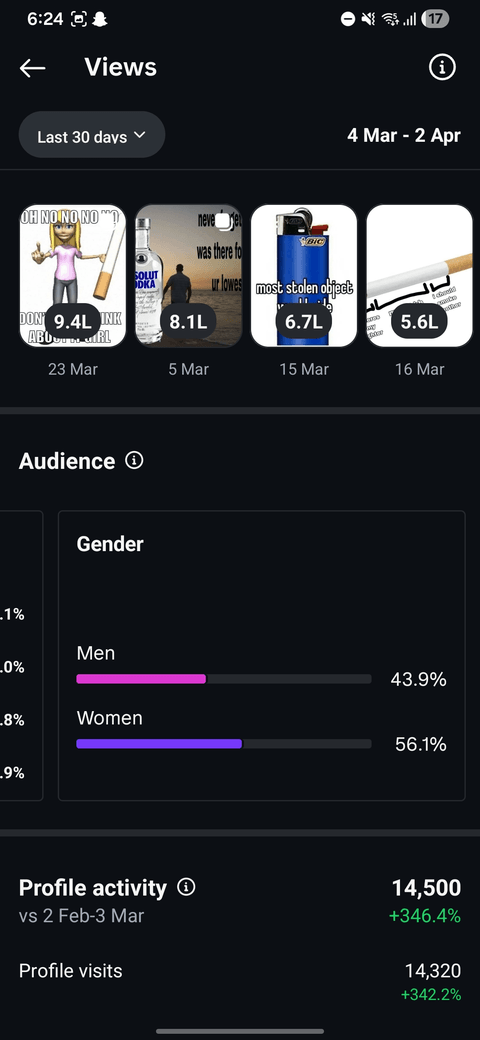
Gender
Female
45.6%
Unknown
41.3%
Male
13.1%
Age range
18 24
59.6%
25 34
28.4%
13 17
4.5%
35 44
4.1%
45 54
1.9%
65
0.8%
55 64
0.6%
Top 10 Hashtags
Keine Daten
replies
Total Value
12
accounts engaged
Total Value
1M
Performance by Media Type
View how your account performs across different types of Instagram content — such as Reels, Stories, and Feed posts. This breakdown helps you understand which media formats drive the most engagement and reach, so you can focus your efforts on the most effective content types.
Total Interactions
Post
99.2%
2.2M
Reel
0.8%
18.8K
Story
0.0%
141
Likes
Total
1.2M
Post
99.1%
1.2M
Reel
0.9%
10.6K
Views
Total
12.8M
Carousel Item
0.0%
57
Story
0.5%
63.6K
Reel
1.1%
138K
Carousel Container
85.3%
10.9M
Post
13.1%
1.6M
0.0%
3
Comments
Total
745
Reel
1.1%
8
Post
98.9%
737
Shares
Total
429.3K
Post
99.2%
425.9K
Reel
0.8%
3.4K
Saves
Total
70.7K
Post
99.4%
70.3K
Reel
0.6%
438
Reach
Total
6.5M
Carousel Item
0.0%
2
Carousel Container
86.7%
6M
Post
12.3%
853.7K
Reel
0.8%
58K
Story
0.2%
10.9K
0.0%
2
Follower vs Non-Follower Engagement
Displays how this metric differs between followers and non-followers, allowing you to identify which audience group contributes more. Use this insight to evaluate reach, interest, and overall engagement across different audience segments.
Views
Total
12.8M
Follower
8.5%
1M
Non Follower
91.5%
11.7M
Unknown
0.0%
501
Reach
Total
6.5M
Non Follower
99.6%
6.5M
Follower
0.4%
26.1K
Non Follower
100%
Follower
0%
Account Reach Over Time
Track how many unique accounts have seen your content over time. This metric shows your overall visibility and audience growth, helping you identify trends, peak performance days, and the impact of your recent posts or campaigns.
reach
- Total
- 9.2M
- Average
- 102.3K
- Peak
- 497.8K
- Last 7 Days Avg
- 375.8K
Beschreibung
Keine Daten
Hochladen von Insights
Letzte Beiträge
170K
148

143.9K
140

63.5K
60

47K
67

42.7K
28

20K
8

20K
6

19.8K
2

19.1K
1

16K
3

12.2K
10

11.4K
12

11.4K
4

11.1K
2

10K
5

5.5K
10

4.5K
32

4.1K
1

3.7K
2

3.6K
2

3.6K
0

2.3K
1

2.1K
0

2.1K
0

2K
0

1.9K
0

1.8K
0

1.7K
0

1.5K
1

1.5K
0

1.3K
0

1.1K
0

1.1K
0

1.1K
3

868
0

836
0

726
0

723
2

645
0

527
0

451
0

424
0

406
1

393
1

375
1

224
0

145
1

145
0

9
0

0
0

SeBuDA
Kürzlich wurde unser Hauptsitz von den USA in die Niederlande verlegt, damit wir unseren Nutzern mehr Funktionen bieten können. Wir sind sicher, dass unsere Nutzer die Änderungen in Zukunft spüren werden, und diese Entscheidung wurde zu ihrem Vorteil getroffen.
Netherland
Sebuda B.V.
CoC Number: 95490469
Zuid-Hollandlaan 7, 2596AL ‘s-Gravenhage
The Hauge, The Netherlands
(+31)0687365374
Seien Sie mit uns in den sozialen Netzwerken
Social-Media-Konten zum Verkauf
Hilfe und Services
© 2022 SeBuDA.com, All rights reserved.