
All data for this account is guaranteed by the website
Share to ...
Copy Link
Priyanshu890*******kir__01 | 1K followers instagram account
40 months aged
@*******kir__01

Posts
11

Followers
1K
Following
73


Date of Joined
Dec 2022

Date of First Post
Jan 1, 2023

Date of Last Post
Dec 29, 2025
All (Last 3 Months)

151
4.4K
5
2
1
Averages
2
50
0
0
0
Engagement over time
Likes
Comments
Video to photo ratio
Pictures
Videos
Post/Per Month
Besties

Most Liked
1.6K

Most Commented
5
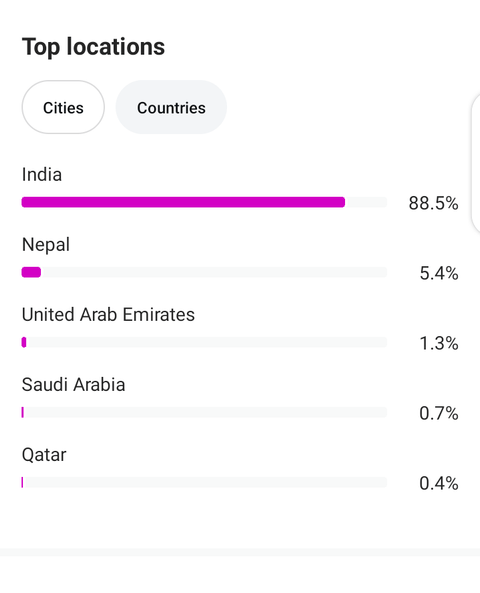
Top Countries
India
89.4%
Nepal
5.2%
United Arab Emirates
1.1%
Saudi Arabia
0.7%
Qatar
0.4%
United States
0.4%
Pakistan
0.4%
Spain
0.3%
Uzbekistan
0.2%
Kuwait
0.2%
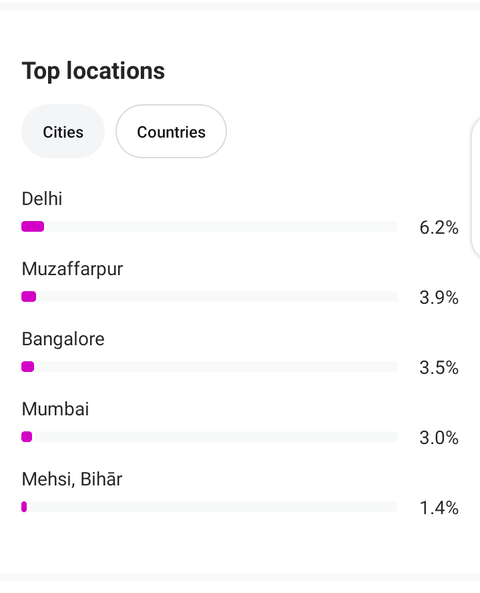
Top Cities
Delhi Delhi
13.6%
Muzaffarpur Bihar
10.0%
Bangalore Karnataka
8.6%
Mumbai Maharashtra
5.9%
Mehsi Bihar
3.9%
Kathmandu Bagmati Zone
3.2%
Ahmedabad Gujarat
3.2%
Lauriya Nandangarh Bihar
3.2%
Patna Bihar
2.9%
Hyderabad Telangana
2.9%
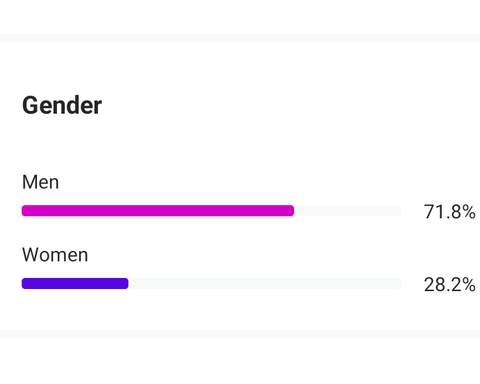
Gender
Male
60.7%
Female
24.4%
Unknown
15.0%
Age range
18 24
42.9%
25 34
27.5%
13 17
20.7%
35 44
5.4%
45 54
1.9%
65
1.0%
55 64
0.7%
Top 10 Hashtags
replies
Total Value
5
accounts engaged
Total Value
131
Performance by Media Type
View how your account performs across different types of Instagram content — such as Reels, Stories, and Feed posts. This breakdown helps you understand which media formats drive the most engagement and reach, so you can focus your efforts on the most effective content types.
Total Interactions
Post
22.2%
37
Reel
74.3%
124
Story
3.6%
6
Likes
Total
151
Post
22.5%
34
Reel
77.5%
117
Views
Total
4.4K
Reel
25.3%
1.1K
Carousel Container
4.2%
187
Story
32.5%
1.4K
Post
38.0%
1.6K
Comments
Total
5
Reel
40.0%
2
Post
60.0%
3
Shares
Total
2
Reel
100.0%
2
Saves
Total
1
Reel
100.0%
1
Reach
Total
826
Story
35.8%
341
Post
5.4%
51
Reel
56.0%
534
Carousel Container
2.8%
27
Follower vs Non-Follower Engagement
Displays how this metric differs between followers and non-followers, allowing you to identify which audience group contributes more. Use this insight to evaluate reach, interest, and overall engagement across different audience segments.
Views
Total
4.4K
Unknown
0.1%
4
Non Follower
43.5%
1.9K
Follower
56.4%
2.5K
Reach
Total
826
Follower
18.7%
156
Non Follower
81.3%
679
Follower
19%
Non Follower
81%
Account Reach Over Time
Track how many unique accounts have seen your content over time. This metric shows your overall visibility and audience growth, helping you identify trends, peak performance days, and the impact of your recent posts or campaigns.
reach
- Total
- 1.4K
- Average
- 16
- Peak
- 157
- Last 7 Days Avg
- 35
Description
No Data
Upload Insight
Last Posts

1.6K
3

651
5

162
3

0
1

0
1

0
1

0
0

4
0

0
0

0
0

0
0

Listing Statistics
544
13 days ago
SeBuDA
Recently our headquarters moved from USA to Netherland so we could make more features for our users, we sure that our users can feel the changes in the future and this decision is for sake of our users
Netherland
Sebuda B.V.
CoC Number: 95490469
Zuid-Hollandlaan 7, 2596AL ‘s-Gravenhage
The Hauge, The Netherlands
(+31)0687365374
Be with us on Social Networks
Social media accounts for sale
Help and Services
© 2022 SeBuDA.com, All rights reserved.