
All data for this account is guaranteed by the website
Share to ...
Copy Link
Darell******milee | 11.4K followers instagram account
1 months aged
@******milee

Posts
74

Followers
11.4K
Following
1


Date of Joined
Jan 2026

Date of First Post
Jan 2, 2026

Date of Last Post
Jul 14, 2025
All (Last 3 Months)

386
17.6K
5
379
0
Averages
4
196
0
4
No data
Engagement over time
Likes
Comments
Video to photo ratio
Pictures
Videos
Post/Per Month
Besties

Most Liked
175.1K
Most Commented
341
Top Countries
United States
69.7%
United Kingdom
3.4%
Canada
2.2%
Brazil
2.2%
Mexico
2.0%
Australia
1.9%
Italy
1.5%
Germany
1.3%
South Africa
1.2%
Argentina
1.0%
Top Cities
New York New York
15.8%
Houston Texas
5.6%
Los Angeles California
5.2%
Chicago Illinois
4.7%
Philadelphia Pennsylvania
3.8%
Detroit Michigan
3.3%
Dallas Texas
2.9%
Phoenix Arizona
2.6%
Baltimore Maryland
2.5%
San Antonio Texas
2.4%
Gender
Male
68.6%
Unknown
26.1%
Female
5.3%
Age range
18 24
36.2%
25 34
35.7%
13 17
13.4%
35 44
9.9%
45 54
2.7%
65
1.4%
55 64
0.7%
Top 10 Hashtags
replies
Total Value
0
accounts engaged
Total Value
497
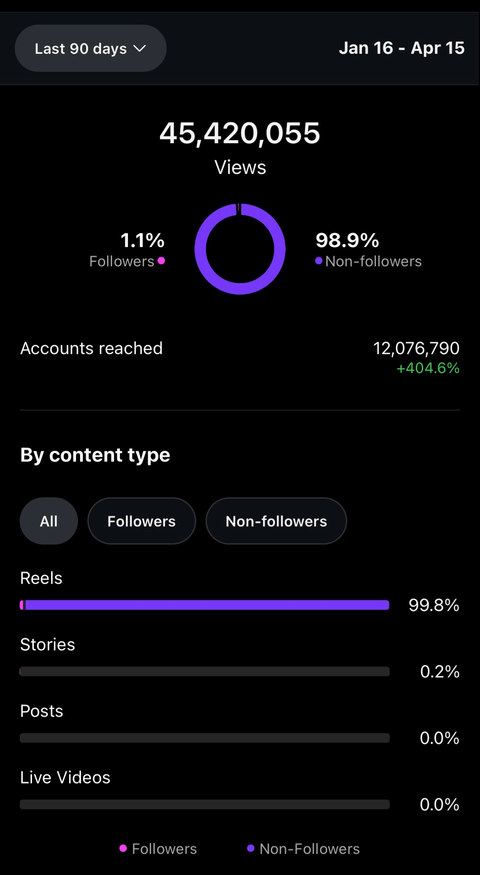
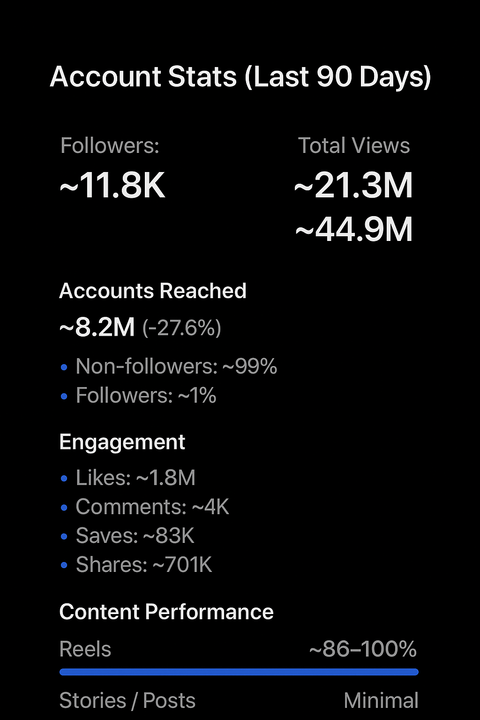
Performance by Media Type
View how your account performs across different types of Instagram content — such as Reels, Stories, and Feed posts. This breakdown helps you understand which media formats drive the most engagement and reach, so you can focus your efforts on the most effective content types.
Total Interactions
Post
0.1%
1
Reel
99.9%
1.1K
Likes
Total
386
Post
0.3%
1
Reel
99.7%
385
Views
Total
17.6K
Story
2.0%
349
Post
5.0%
879
Reel
93.0%
16.3K
Comments
Total
5
Reel
100.0%
5
Shares
Total
379
Reel
100.0%
379
Reach
Total
9K
Story
0.4%
41
Post
0.7%
66
Reel
98.8%
9K
Follower vs Non-Follower Engagement
Displays how this metric differs between followers and non-followers, allowing you to identify which audience group contributes more. Use this insight to evaluate reach, interest, and overall engagement across different audience segments.
Views
Total
17.6K
Unknown
0.1%
12
Non Follower
89.0%
15.6K
Follower
10.9%
1.9K
Reach
Total
9K
Follower
2.4%
221
Non Follower
97.6%
8.8K
Follower
2%
Non Follower
98%
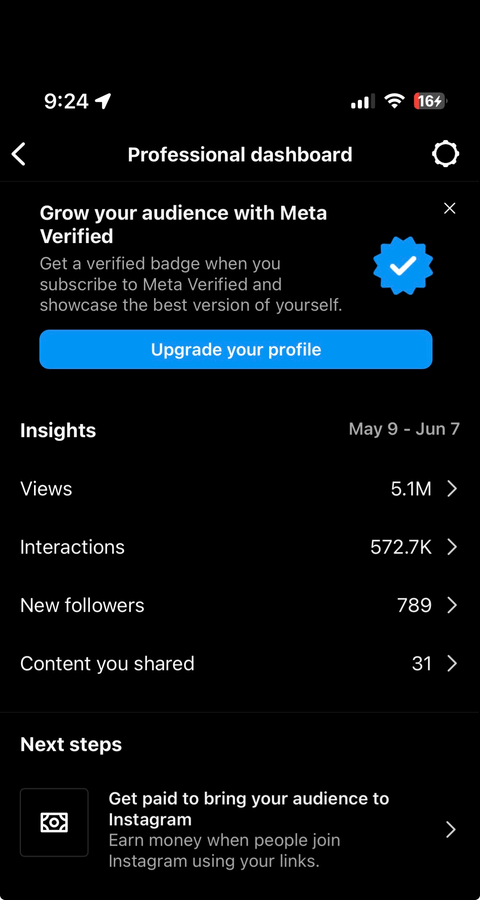
Account Reach Over Time
Track how many unique accounts have seen your content over time. This metric shows your overall visibility and audience growth, helping you identify trends, peak performance days, and the impact of your recent posts or campaigns.
reach
- Total
- 10.5K
- Average
- 114
- Peak
- 446
- Last 7 Days Avg
- 182
Description
44m+
Upload Insight
Last Posts

175.1K
341

78.5K
165

16.1K
78

3.4K
59

1.5K
8

919
1

847
6

525
7

468
2

347
0

331
0

325
2

319
5

310
1

305
1

301
9

281
6

246
1

243
5

237
2

231
2

231
0

193
1

189
0

182
0

174
0

169
3

169
0

165
2

162
0

146
1

138
1

138
0

131
2

120
0

116
1

111
1

103
2

103
0

101
0

92
2

91
3

91
0

84
1

83
0

80
1

67
0

66
1

65
1

41
0

Listing Statistics
222
30 days ago
SeBuDA
Recently our headquarters moved from USA to Netherland so we could make more features for our users, we sure that our users can feel the changes in the future and this decision is for sake of our users
Netherland
Sebuda B.V.
CoC Number: 95490469
Zuid-Hollandlaan 7, 2596AL ‘s-Gravenhage
The Hauge, The Netherlands
(+31)0687365374
Be with us on Social Networks
Social media accounts for sale
Help and Services
© 2022 SeBuDA.com, All rights reserved.