
All data for this account is guaranteed by the website
Share to ...
Copy Link
QH URDU*******s.reels | 1.6K followers instagram account
South Africa, 71% women, 5 months aged
@*******s.reels

Posts
100

Followers
1.6K
Following
3


Date of Joined
Sep 2025

Date of First Post
Oct 1, 2025

Date of Last Post
Jan 22, 2026
All (Last 3 Months)

65K
627.8K
369
40.7K
3.5K
Averages
722
6.9K
4
453
40
Engagement over time
Likes
Comments
Video to photo ratio
Pictures
Videos
Post/Per Month
Besties

Most Liked
153

Most Commented
5
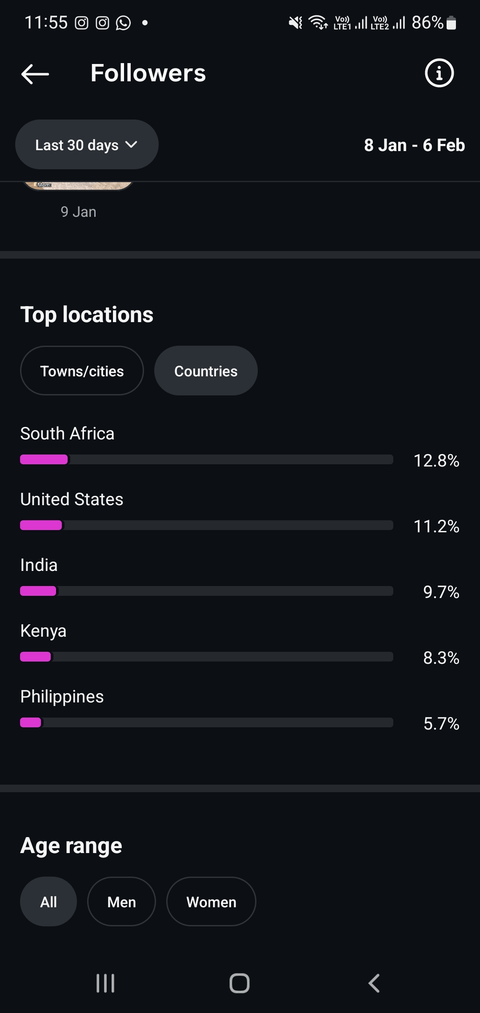
Top Countries
South Africa
14.3%
United States
12.4%
India
10.8%
Kenya
9.2%
Philippines
6.3%
Pakistan
5.1%
Nigeria
4.2%
Uganda
2.7%
United Kingdom
2.4%
Zambia
2.4%
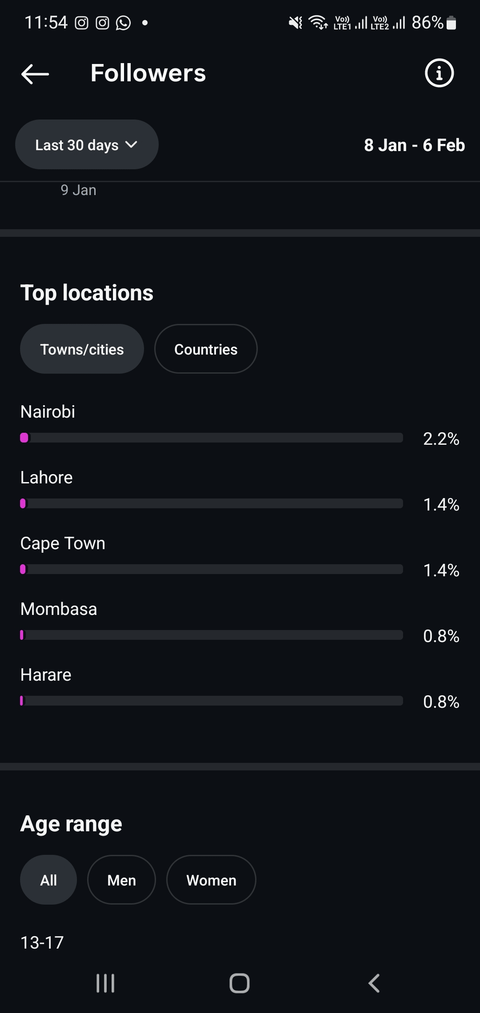
Top Cities
Nairobi Nairobi
10.0%
Lahore Punjab
6.6%
Cape Town Western Cape
6.6%
Mombasa Coast Province
3.8%
Harare Harare Province
3.4%
Chennai Tamil Nadu
3.4%
Dhaka Dhaka Division
2.8%
Kolkata West Bengal
2.8%
New York New York
2.8%
Lusaka Lusaka Province
2.5%
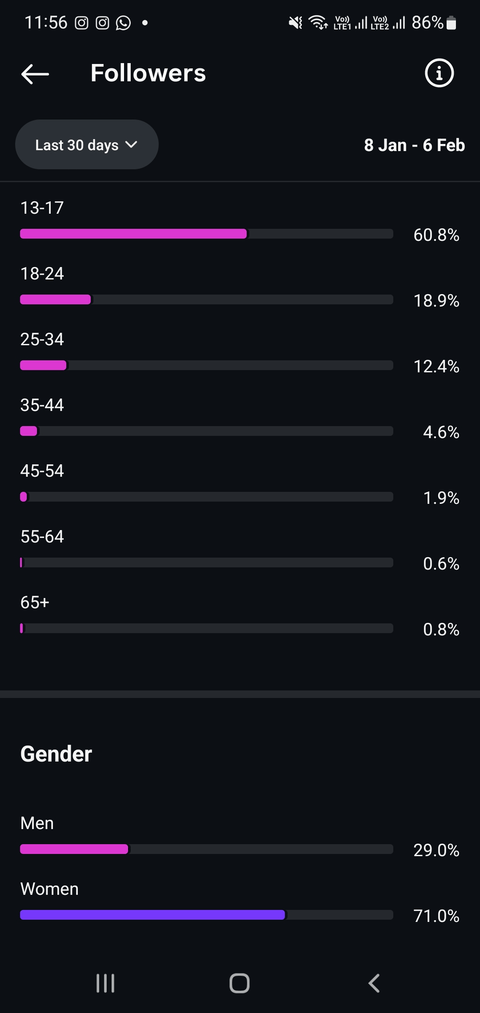
Gender
Unknown
41.6%
Female
41.4%
Male
16.9%
Age range
13 17
68.0%
18 24
16.2%
25 34
10.2%
35 44
3.3%
45 54
1.4%
65
0.5%
55 64
0.3%
Top 10 Hashtags
replies
Total Value
0
accounts engaged
Total Value
78.4K
Performance by Media Type
View how your account performs across different types of Instagram content — such as Reels, Stories, and Feed posts. This breakdown helps you understand which media formats drive the most engagement and reach, so you can focus your efforts on the most effective content types.
Total Interactions
Reel
100.0%
155.3K
Likes
Total
65K
Reel
100.0%
65K
Views
Total
627.8K
Reel
100.0%
627.8K
Comments
Total
369
Reel
100.0%
369
Shares
Total
40.7K
Reel
100.0%
40.7K
Saves
Total
3.5K
Reel
100.0%
3.5K
Reach
Total
422.1K
Reel
100.0%
422.1K
Follower vs Non-Follower Engagement
Displays how this metric differs between followers and non-followers, allowing you to identify which audience group contributes more. Use this insight to evaluate reach, interest, and overall engagement across different audience segments.
Views
Total
627.8K
Unknown
0.1%
556
Non Follower
96.9%
608.2K
Follower
3.0%
19K
Reach
Total
422.1K
Follower
0.2%
1K
Non Follower
99.8%
420K
Follower
0%
Non Follower
100%
Account Reach Over Time
Track how many unique accounts have seen your content over time. This metric shows your overall visibility and audience growth, helping you identify trends, peak performance days, and the impact of your recent posts or campaigns.
reach
- Total
- 465K
- Average
- 5K
- Peak
- 12K
- Last 7 Days Avg
- 5.8K
Description
No Data
Upload Insight
Last Posts

153
0

117
2

64
1

54
1

48
0

47
0

47
0

44
0

44
0

42
2

42
0

37
0

34
5

34
1

34
0

33
2

33
1

32
2

31
1

31
0

30
2

29
0

29
0

29
0

28
0

28
0

27
1

27
1

27
0

26
0

25
0

24
2

24
1

22
1

22
0

22
0

21
0

20
1

20
0

19
1

18
1

17
1

17
0

16
1

16
0

15
1

15
0

15
0

14
0

7
0

Listing Statistics
232
20 days ago
SeBuDA
Recently our headquarters moved from USA to Netherland so we could make more features for our users, we sure that our users can feel the changes in the future and this decision is for sake of our users
Netherland
Sebuda B.V.
CoC Number: 95490469
Zuid-Hollandlaan 7, 2596AL ‘s-Gravenhage
The Hauge, The Netherlands
(+31)0687365374
Be with us on Social Networks
Social media accounts for sale
Help and Services
© 2022 SeBuDA.com, All rights reserved.