
All data for this account is guaranteed by the website
Share to ...
Copy Link
Millieir******gram_ | 110.8K followers instagram account
United States, 83% men, 70 months aged
@******gram_

Posts
2.5K

Followers
110.8K
Following
394


Date of Joined
May 2020

Date of First Post
Jun 1, 2020

Date of Last Post
Feb 13, 2026
All (Last 3 Months)

16.2K
787.7K
851
8.1K
2.4K
Averages
180
8.7K
9
90
27
Engagement over time
Likes
Comments
Video to photo ratio
Pictures
Videos
Post/Per Month
Besties

Most Liked
Most Commented
63
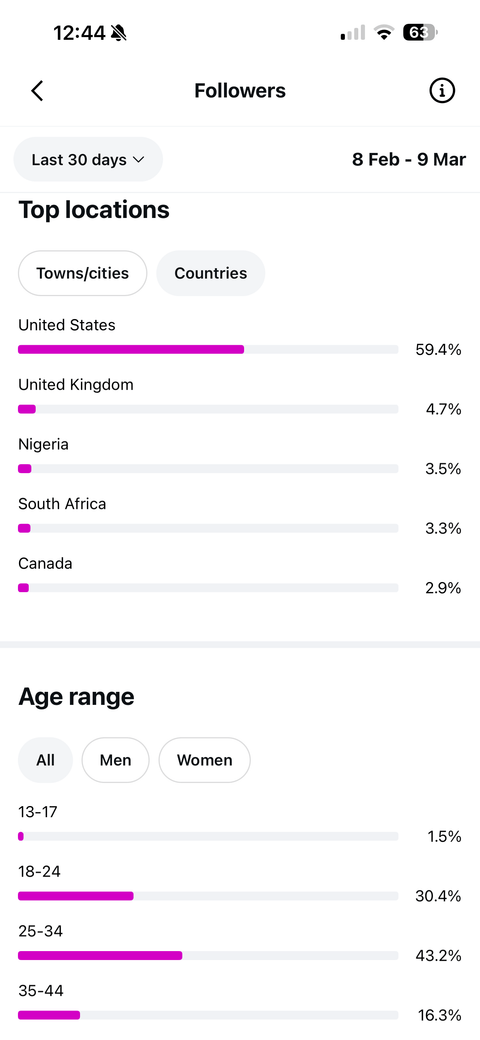
Top Countries
United States
64.0%
United Kingdom
5.0%
Nigeria
3.8%
South Africa
3.5%
Canada
3.1%
Australia
1.9%
India
1.5%
Ghana
1.4%
Kenya
1.2%
Germany
0.8%
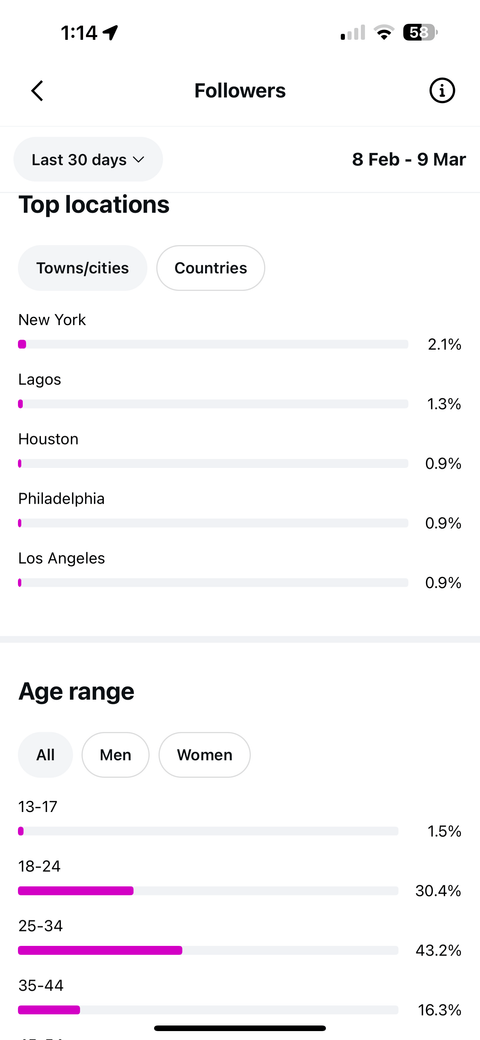
Top Cities
New York New York
10.5%
Lagos Lagos State
6.5%
Houston Texas
4.5%
Philadelphia Pennsylvania
4.4%
Los Angeles California
4.4%
London England
3.7%
Chicago Illinois
3.6%
Accra Greater Accra Region
3.3%
Nairobi Nairobi
3.2%
Cape Town Western Cape
2.9%
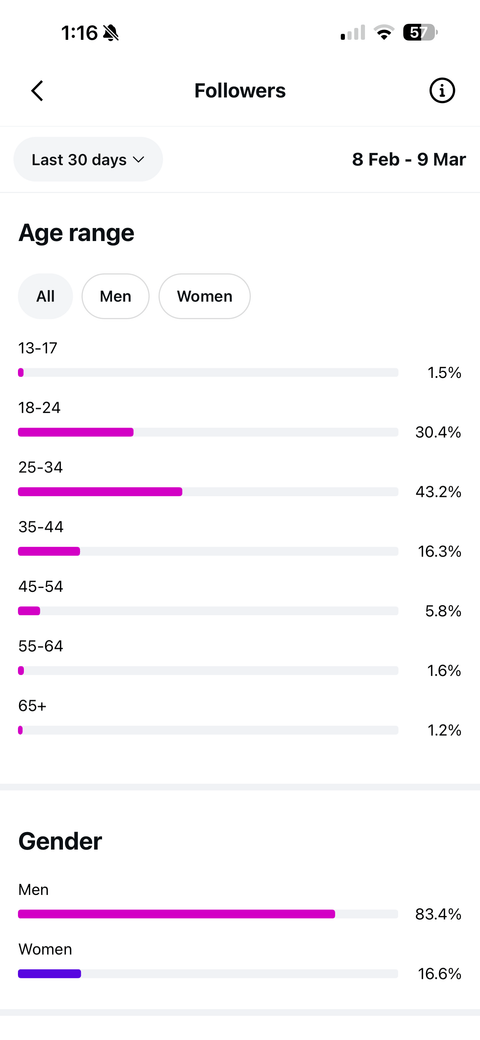
Gender
Male
65.6%
Unknown
21.3%
Female
13.1%
Age range
25 34
43.0%
18 24
31.6%
35 44
15.5%
45 54
5.5%
13 17
1.6%
55 64
1.5%
65
1.3%
Top 10 Hashtags
replies
Total Value
1
accounts engaged
Total Value
16.4K
Performance by Media Type
View how your account performs across different types of Instagram content — such as Reels, Stories, and Feed posts. This breakdown helps you understand which media formats drive the most engagement and reach, so you can focus your efforts on the most effective content types.
Total Interactions
Igtv
-0.0%
-7
Reel
85.6%
30.6K
Post
14.4%
5.1K
Story
0.0%
2
Likes
Total
16.2K
Igtv
0.0%
3
Reel
81.3%
13.1K
Post
18.6%
3K
Views
Total
787.7K
Story
0.2%
1.9K
Carousel Container
9.9%
78.3K
Post
6.7%
53K
Reel
83.1%
654.2K
Igtv
0.0%
216
Comments
Total
851
Post
12.5%
106
Reel
87.5%
745
Shares
Total
8.1K
Reel
90.0%
7.3K
Post
10.0%
815
Saves
Total
2.4K
Igtv
-0.4%
-10
Post
16.6%
408
Reel
83.8%
2K
Reach
Total
24.3K
Story
3.8%
1K
Carousel Container
20.8%
5.7K
Reel
69.7%
19.2K
Post
4.7%
1.2K
Igtv
1.0%
281
Follower vs Non-Follower Engagement
Displays how this metric differs between followers and non-followers, allowing you to identify which audience group contributes more. Use this insight to evaluate reach, interest, and overall engagement across different audience segments.
Views
Total
787.7K
Follower
53.5%
421.2K
Non Follower
46.5%
366.3K
Unknown
0.0%
175
Reach
Total
24.3K
Follower
26.0%
6.4K
Non Follower
74.0%
18.3K
Follower
26%
Non Follower
74%
Account Reach Over Time
Track how many unique accounts have seen your content over time. This metric shows your overall visibility and audience growth, helping you identify trends, peak performance days, and the impact of your recent posts or campaigns.
reach
- Total
- 32.8K
- Average
- 365
- Peak
- 2.2K
- Last 7 Days Avg
- 205
Description
110K Instagram rap/hip-hop theme page. • 110.9K followers • 465K monthly views • Majority US audience • Created June 2020 • 2500+ posts • Clean account with no strikes • Original email included Great for music promotion, rap culture content, and meme pages.
Upload Insight
Last Posts
0
63

0
58

0
48

0
35

408
27

0
27

2.9K
23

0
18

1.1K
14

0
13

458
12

0
11

0
9

0
7

0
6

0
6

524
2

513
3

435
3

246
6

0
5

0
5

352
5

0
4

0
4

389
4

0
3

290
3

281
3

0
2

0
2

0
2

0
2

0
1

61
1

6
1

0
1

0
1

0
1

0
1

0
1

0
1

318
1

240
1

0
0

0
0

0
0

0
0

0
0

210
0

Listing Statistics
223
28 days ago
SeBuDA
Recently our headquarters moved from USA to Netherland so we could make more features for our users, we sure that our users can feel the changes in the future and this decision is for sake of our users
Netherland
Sebuda B.V.
CoC Number: 95490469
Zuid-Hollandlaan 7, 2596AL ‘s-Gravenhage
The Hauge, The Netherlands
(+31)0687365374
Be with us on Social Networks
Social media accounts for sale
Help and Services
© 2022 SeBuDA.com, All rights reserved.