
All data for this account is guaranteed by the website
Share to ...
Copy Link
Sanifg67*******nsshort | 7.1K followers instagram account
56% men, 7 months aged
@*******nsshort

Posts
241

Followers
7.1K
Following
_


Date of Joined
Nov 2025

Date of First Post
Dec 1, 2025

Date of Last Post
Apr 26, 2026
All (Last 3 Months)

155.5K
990.4K
56.7K
22.5K
4.4K
Averages
1.7K
11K
630
250
50
Engagement over time
Likes
Comments
Video to photo ratio
Pictures
Videos
Post/Per Month
Besties

Most Liked
Most Commented
1K
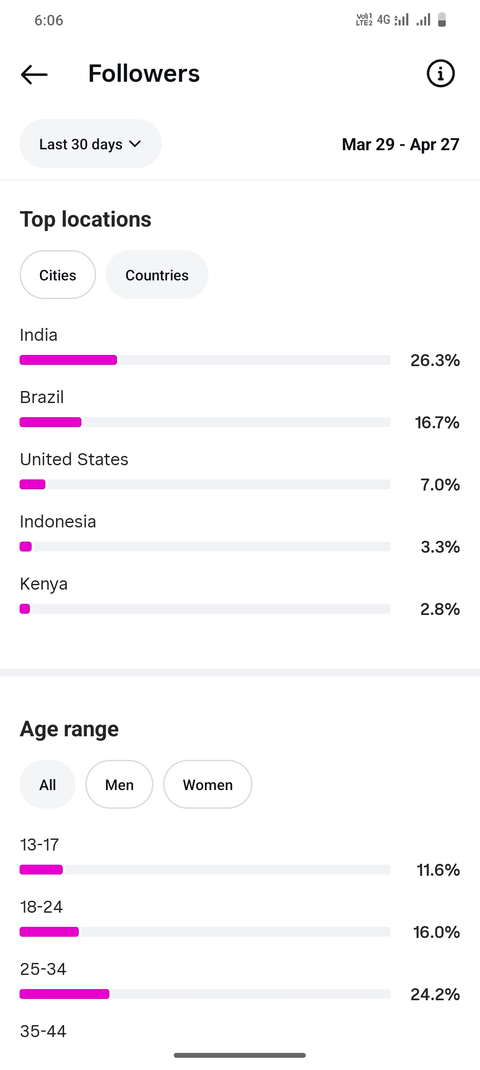
Top Countries
India
29.6%
Brazil
18.8%
United States
7.9%
Indonesia
3.7%
Kenya
3.1%
Nigeria
2.9%
Tanzania
2.7%
Mexico
2.4%
Philippines
2.4%
Iran
2.1%
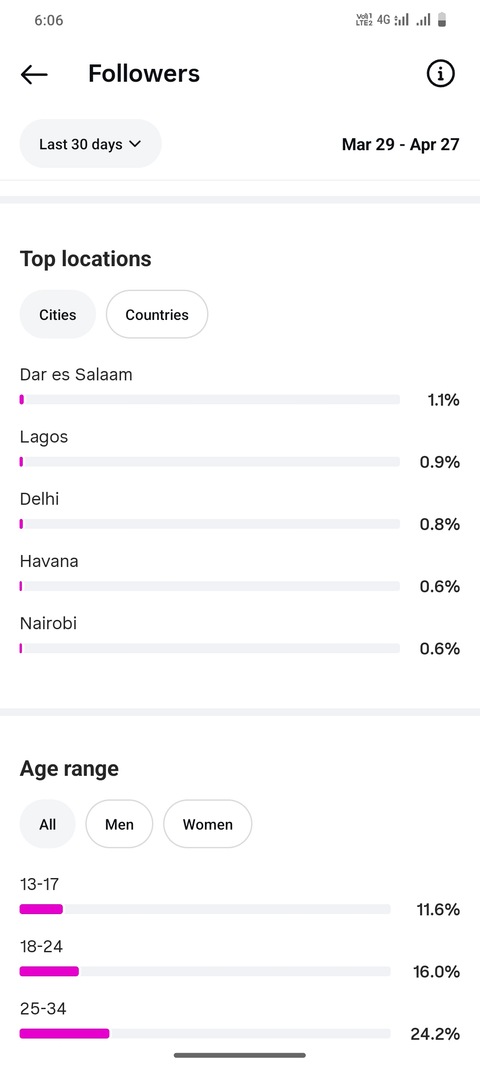
Top Cities
Dar Es Salaam Dar Es Salaam
8.0%
Lagos Lagos State
6.5%
Delhi Delhi
6.1%
Havana Havana
4.5%
Nairobi Nairobi
4.3%
Semnan Semnan Province
3.7%
São Paulo São Paulo State
3.2%
Jammu Jammu And Kashmir
3.2%
Mumbai Maharashtra
3.2%
Dodoma Dodoma
2.7%
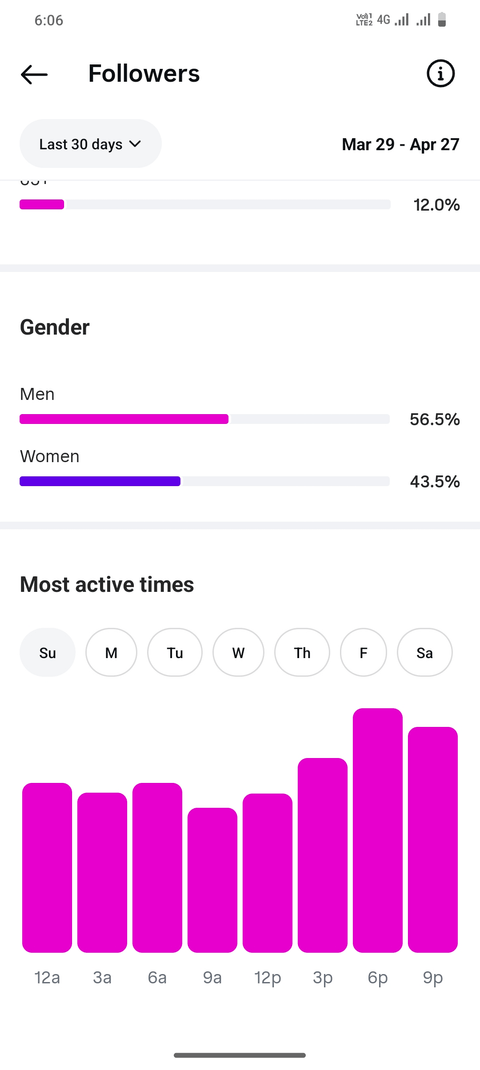
Gender
Male
41.0%
Female
31.7%
Unknown
27.3%
Age range
25 34
24.0%
18 24
16.3%
35 44
14.8%
13 17
13.0%
65
12.3%
45 54
10.4%
55 64
9.2%
Top 10 Hashtags
replies
Total Value
0
accounts engaged
Total Value
81.8K
Performance by Media Type
View how your account performs across different types of Instagram content — such as Reels, Stories, and Feed posts. This breakdown helps you understand which media formats drive the most engagement and reach, so you can focus your efforts on the most effective content types.
Total Interactions
Reel
100.0%
272.3K
Likes
Total
155.5K
Reel
100.0%
155.5K
Views
Total
990.4K
Reel
100.0%
990.4K
Comments
Total
56.7K
Reel
100.0%
56.7K
Shares
Total
22.5K
Reel
100.0%
22.5K
Saves
Total
4.4K
Reel
100.0%
4.4K
Reach
Total
354.5K
Reel
100.0%
354.5K
Follower vs Non-Follower Engagement
Displays how this metric differs between followers and non-followers, allowing you to identify which audience group contributes more. Use this insight to evaluate reach, interest, and overall engagement across different audience segments.
Views
Total
990.4K
Unknown
0.5%
4.7K
Non Follower
91.4%
904.9K
Follower
8.2%
80.7K
Reach
Total
354.5K
Non Follower
98.6%
351.9K
Follower
1.4%
5.1K
Non Follower
99%
Follower
1%
Account Reach Over Time
Track how many unique accounts have seen your content over time. This metric shows your overall visibility and audience growth, helping you identify trends, peak performance days, and the impact of your recent posts or campaigns.
reach
- Total
- 557.5K
- Average
- 6.1K
- Peak
- 28.8K
- Last 7 Days Avg
- 600
Description
No Data
Upload Insight
Last Posts

0
1K

0
1K

0
963

0
496

0
387

0
348

0
341

0
334

0
332

0
274

0
262

0
141

0
115

0
93

0
84

0
79

0
69

0
68

0
62

0
62

0
57

0
57

0
54

0
53

0
51

0
51

0
48

0
48

0
47

0
44

0
43

0
38

0
38

0
37

0
36

0
36

0
36

0
35

0
34

0
34

0
32

0
32

0
29

0
28

0
27

0
27

0
25

0
24

0
23

0
23

Listing Statistics
337
4 days ago
SeBuDA
Recently our headquarters moved from USA to Netherland so we could make more features for our users, we sure that our users can feel the changes in the future and this decision is for sake of our users
Netherland
Sebuda B.V.
CoC Number: 95490469
Zuid-Hollandlaan 7, 2596AL ‘s-Gravenhage
The Hauge, The Netherlands
(+31)0687365374
Be with us on Social Networks
Social media accounts for sale
Help and Services
© 2022 SeBuDA.com, All rights reserved.