
All data for this account is guaranteed by the website
Share to ...
Copy Link
salmaakter9*******er9223 | 2.4K followers instagram account
60% women, 27 months aged
@*******er9223

Posts
98

Followers
2.4K
Following
408


Date of Joined
Jan 2024

Date of First Post
Feb 1, 2024

Date of Last Post
May 8, 2026
All (Last 3 Months)

197
851
7
1
5
Averages
2
9
0
0
0
Engagement over time
Likes
Comments
Video to photo ratio
Pictures
Videos
Post/Per Month
Besties

Most Liked
206

Most Commented
4
Top Countries
United States
27.1%
United Kingdom
10.3%
Brazil
6.1%
Germany
4.6%
India
4.2%
Canada
3.8%
Japan
3.6%
Bangladesh
3.3%
Italy
3.0%
Australia
3.0%
Top Cities
New York New York
6.1%
Dhaka Dhaka Division
5.0%
Istanbul Istanbul Province
4.7%
Los Angeles California
4.4%
Seoul Seoul
4.2%
Taipei Taipei
4.2%
Melbourne Victoria
4.2%
Santiago Santiago Metropolitan Region
4.2%
London England
3.9%
Sydney New South Wales
3.9%
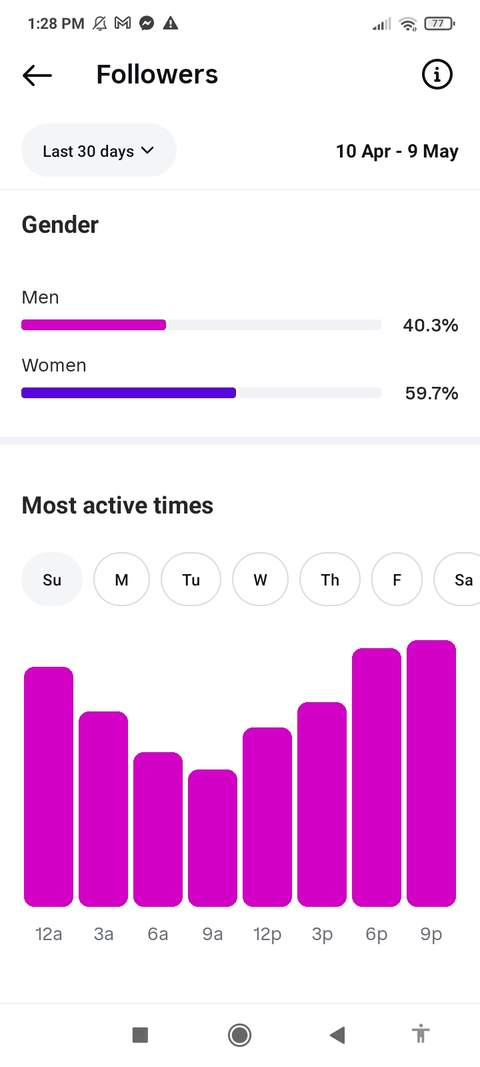
Gender
Female
39.7%
Unknown
33.5%
Male
26.8%
Age range
25 34
31.0%
35 44
26.5%
45 54
18.1%
18 24
10.7%
55 64
8.6%
65
2.6%
13 17
2.4%
Top 10 Hashtags
replies
Total Value
0
accounts engaged
Total Value
62
Performance by Media Type
View how your account performs across different types of Instagram content — such as Reels, Stories, and Feed posts. This breakdown helps you understand which media formats drive the most engagement and reach, so you can focus your efforts on the most effective content types.
Total Interactions
Reel
100.0%
211
Likes
Total
197
Reel
100.0%
197
Views
Total
851
Post
0.4%
3
Reel
99.6%
848
Comments
Total
7
Reel
100.0%
7
Shares
Total
1
Reel
100.0%
1
Saves
Total
5
Reel
100.0%
5
Reach
Total
403
Post
0.5%
2
Reel
99.5%
403
Follower vs Non-Follower Engagement
Displays how this metric differs between followers and non-followers, allowing you to identify which audience group contributes more. Use this insight to evaluate reach, interest, and overall engagement across different audience segments.
Views
Total
851
Unknown
0.2%
2
Non Follower
44.4%
378
Follower
55.3%
471
Reach
Total
403
Non Follower
61.9%
252
Follower
38.1%
155
Non Follower
62%
Follower
38%
Account Reach Over Time
Track how many unique accounts have seen your content over time. This metric shows your overall visibility and audience growth, helping you identify trends, peak performance days, and the impact of your recent posts or campaigns.
reach
- Total
- 437
- Average
- 5
- Peak
- 220
- Last 7 Days Avg
- 38
Description
No Data
Upload Insight
Last Posts

206
1

201
0

168
0

157
0

105
0

64
0

60
0

55
0

53
0

52
4

48
1

31
0

30
0

26
0

24
3

24
1

24
0

22
0

19
2

18
1

16
0

16
0

15
1

15
0

14
1

14
1

13
1

13
0

12
0

12
0

12
0

11
1

11
0

10
0

9
2

9
0

9
0

8
1

8
0

8
0

8
0

7
1

7
0

7
0

6
0

6
0

6
0

5
0

5
0

5
0

Listing Statistics
11
12 hours ago
SeBuDA
Recently our headquarters moved from USA to Netherland so we could make more features for our users, we sure that our users can feel the changes in the future and this decision is for sake of our users
Netherland
Sebuda B.V.
CoC Number: 95490469
Zuid-Hollandlaan 7, 2596AL ‘s-Gravenhage
The Hauge, The Netherlands
(+31)0687365374
Be with us on Social Networks
Social media accounts for sale
Help and Services
© 2022 SeBuDA.com, All rights reserved.