
Share to ...
Copy Link
Social Edge******trixFX | 17.6K followers telegram account
106 months aged
@******trixFX

Followers
17.6K

Price(USD)
$200

Category
Crypto

Date of Joined
Dec 2016

Date of Last Post
Oct 30, 2025
Last 36 posts

texts
0
Pictures
36

Videos
0

audios
0

documents
0
animations
0
Last 36 posts
Averages

Views
4.2K

Post/Per Month
0
Post/Per Month
Besties
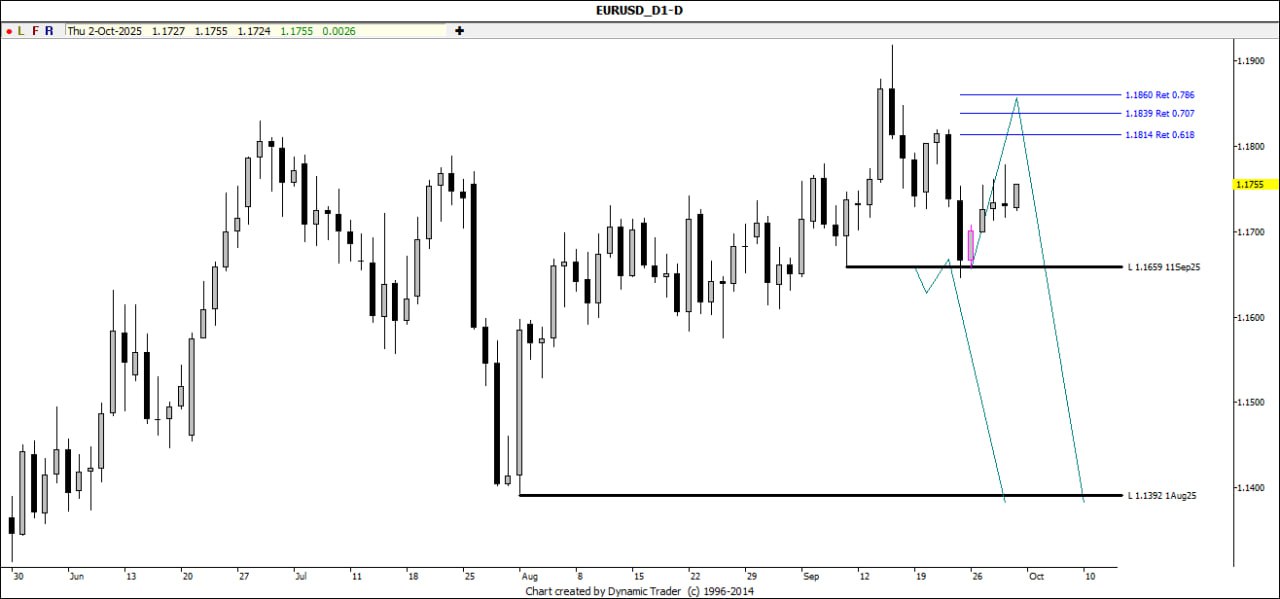
#EURUSD Market Analysis ⚡️ - Technical: On the 4H chart, #EURUSD is showing bullish potential after bouncing from the 1.1727 support zone, aligning with key #Fibonacci retracement levels. Price structure suggests continuation toward higher resistance levels. - Trade: The buy setup remains valid above 1.1727, targeting 1.1814–1.1860. A break below 1.1659 invalidates the bullish bias and signals a potential reversal. #EuroAnalysis #ForexSignals

13.8K
Top 10 Hashtags
Description
No Data
Last Posts
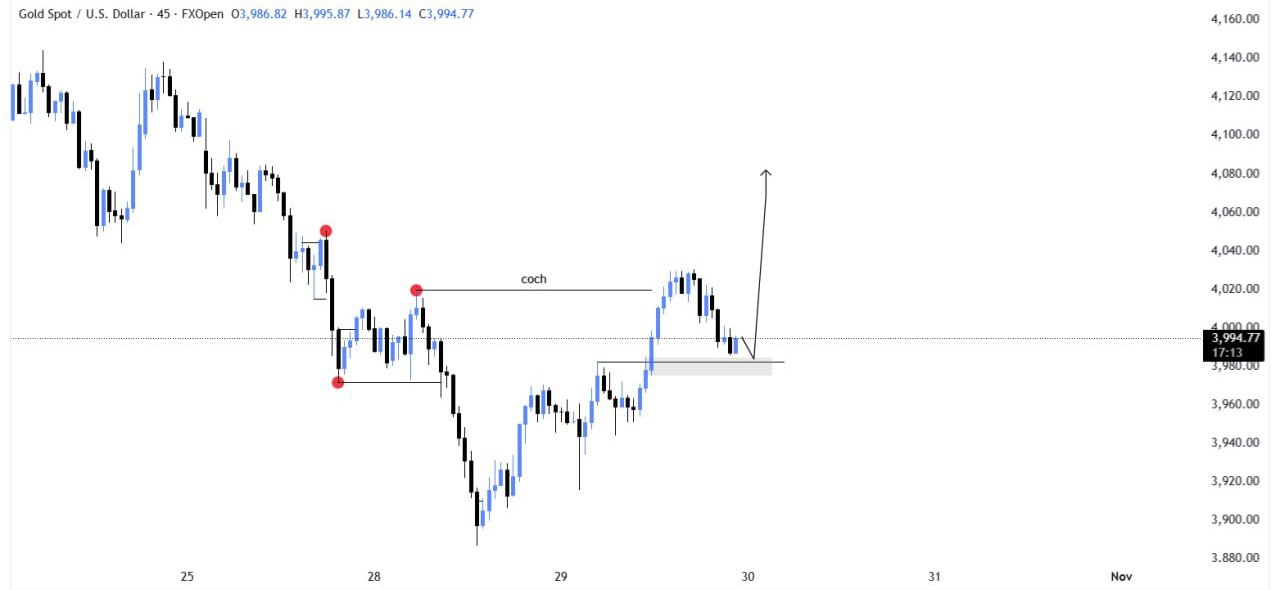
𝗫𝗔𝗨𝗨𝗦𝗗 𝗕𝘂𝘆 𝗧𝗿𝗮𝗱𝗲 ⚡️ 𝗧𝗲𝗰𝗵𝗻𝗶𝗰𝗮𝗹: #XAUUSD has retested support near 3990 after a clean change of character (CHOCH), signaling renewed bullish momentum. Buyers are stepping in around this level with strong rejection wicks. 𝗧𝗿𝗮𝗱𝗲: Buy now 3994, targeting open, with stop loss 3970. Upside continuation is expected if price holds above 3985–3990. #XAUUSD #ForexSignals
1.6K
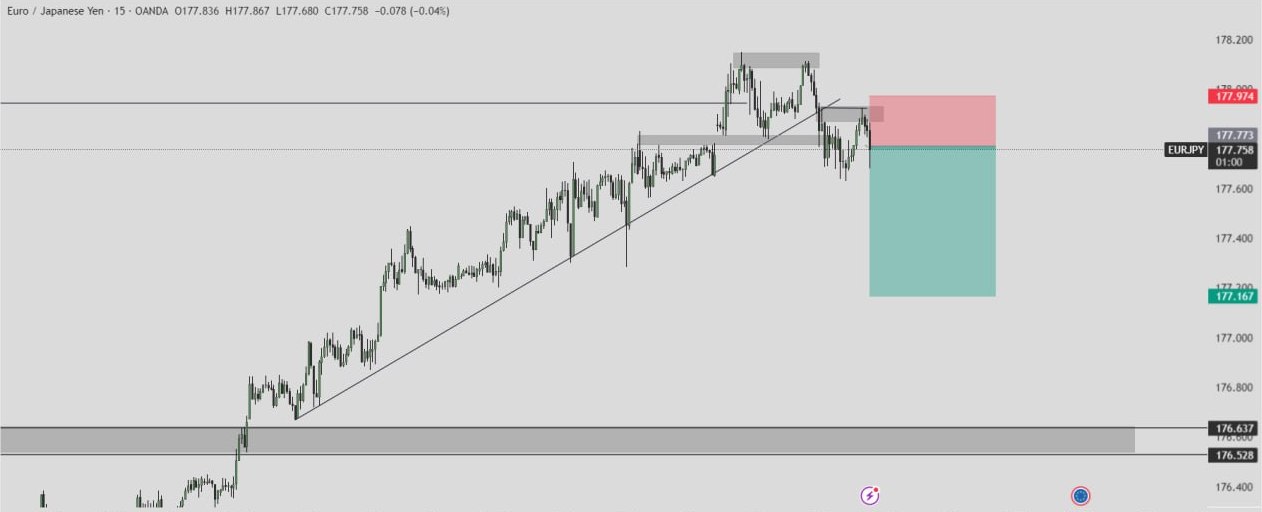
#EUR/JPY 🔴 Sell Limit Entry Point: 177.77 Profit Targets: 177.16, 176.63 Exit Point: 177.97 #EUR/JPY showing bearish rejection from broken trendline and resistance zone, signaling potential downside continuation. ------------------------------- Trade at your own risk. Prioritize money management: assess risk, set limits, and never invest more than you can afford to lose.
2.3K
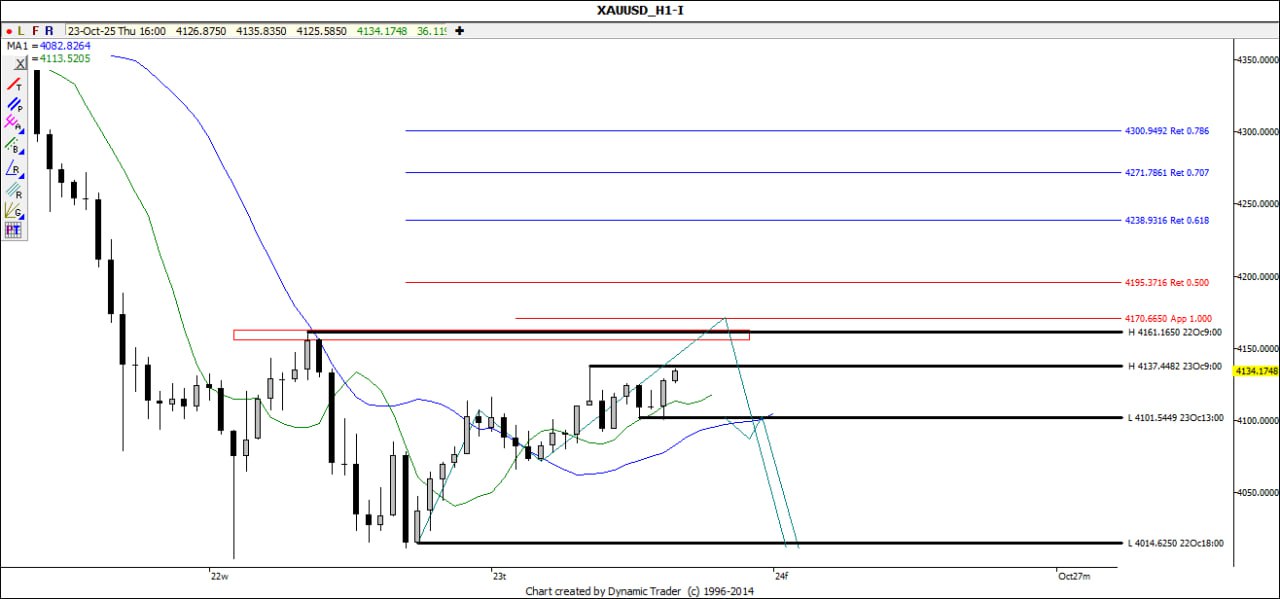
#XAUUSD Market Analysis ⚡️ - Technical: On the 1H chart, #XAUUSD is approaching the $4,160–$4,170 resistance zone, aligning with the Fib 1.000 extension and previous supply area. Price has shown rejection patterns, suggesting potential exhaustion in bullish momentum. - Trade: A reversal from this zone could trigger a drop toward $4,110–$4,080. A clean breakout above $4,175 would invalidate the bearish setup. #GoldAnalysis #ForexSignals
3.6K
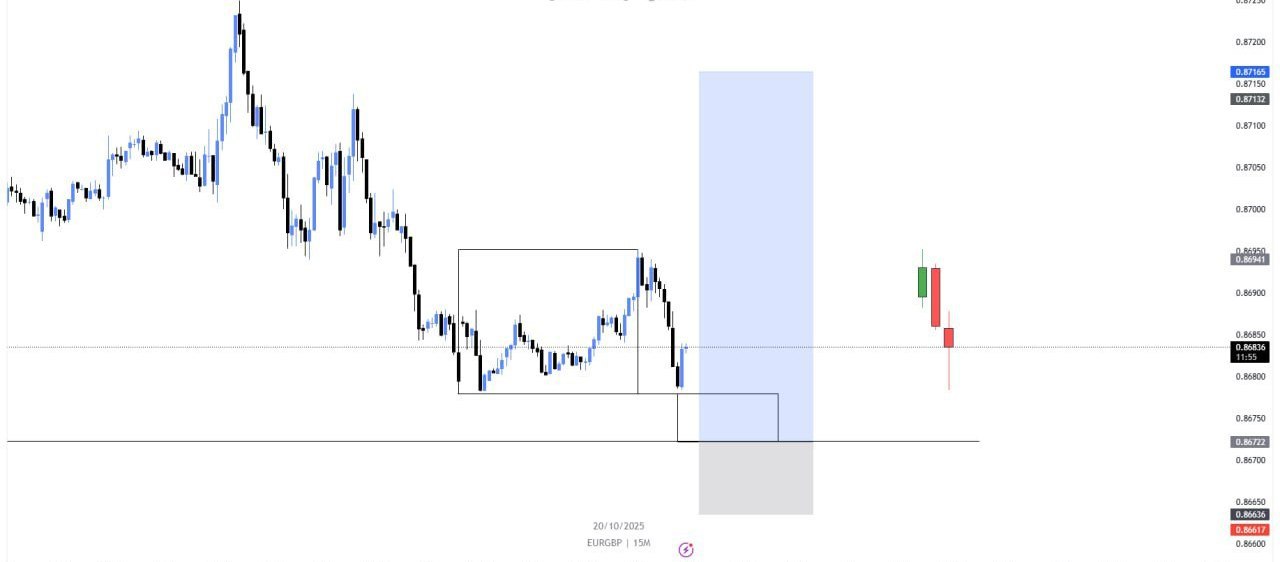
#EUR/GBP 🟢 Buy Limit Entry Point: 0.8672 Profit Targets: 0.8694, 0.8716 Exit Point: 0.8660 #EUR/GBP forming a bullish setup near demand zone with potential recovery toward resistance targets. ------------------------------- Trade at your own risk. Prioritize money management: assess risk, set limits, and never invest more than you can afford to lose.
4.7K
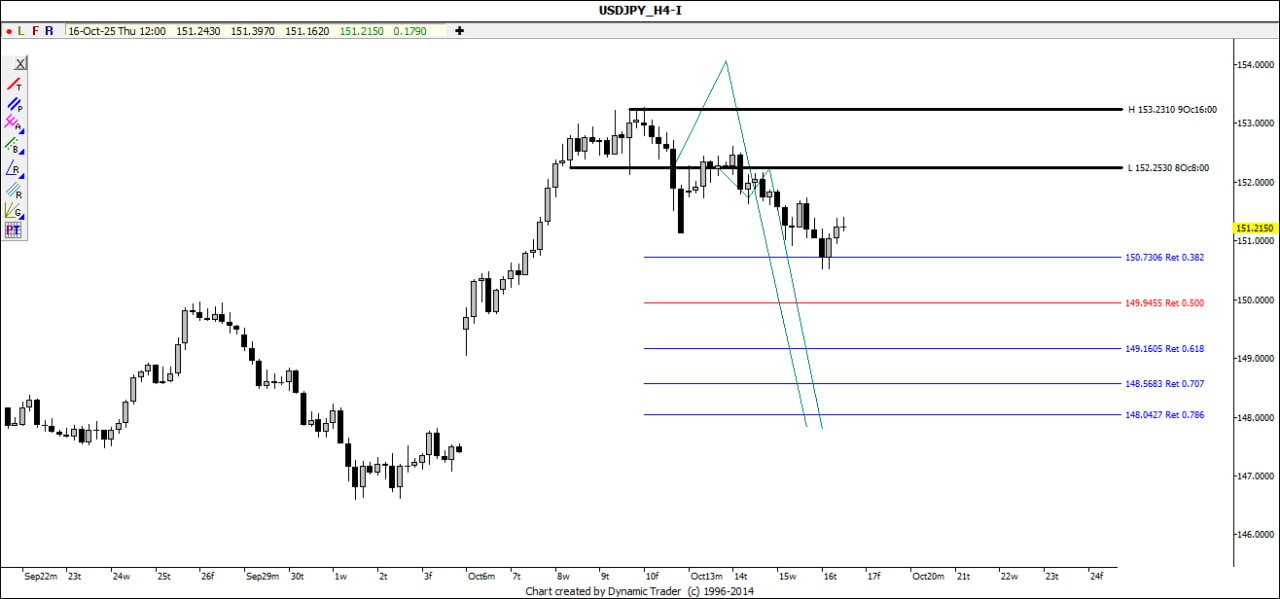
#USDJPY Market Analysis ⚡️ - Technical: On the 4H chart, #USDJPY is retracing after a sharp drop, testing the 151.20–151.40 resistance zone. Price remains bearish below 152.25, with downside targets aligning near 150.70 and 149.90 (Fib 0.5 level). - Trade: Sellers may re-enter on rejection from resistance; above 152.30 invalidates the bearish setup. #ForexSignals #USDJPY
6.1K
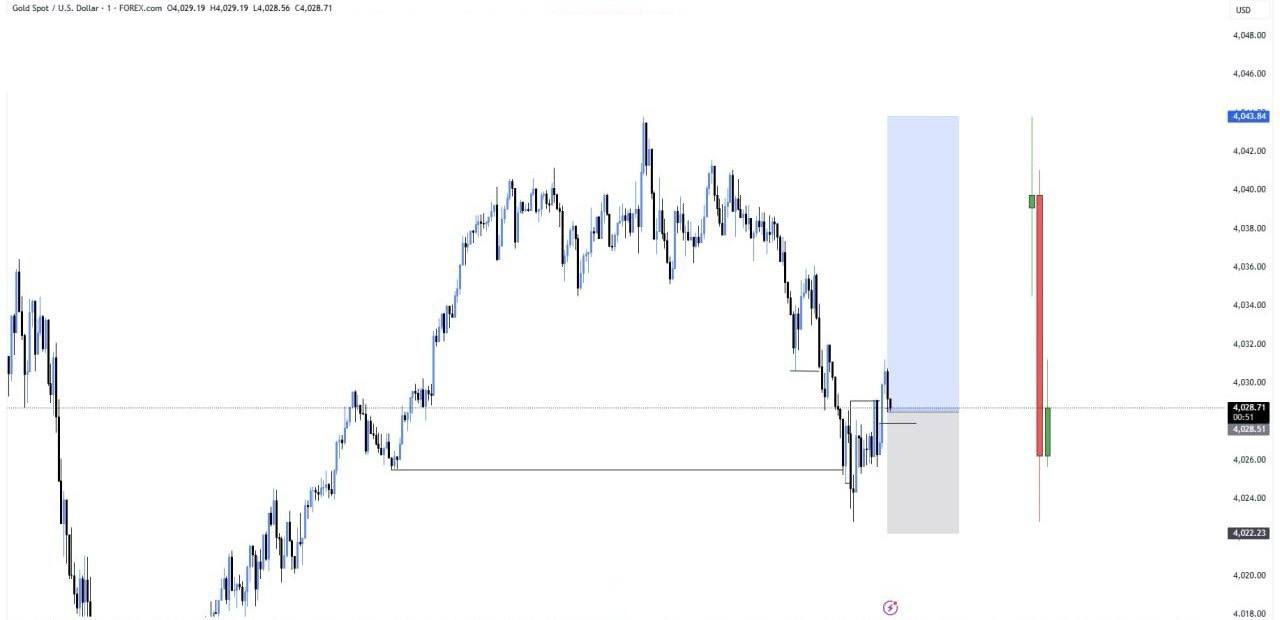
#XAUUSD Market Analysis ⚡️ - Technical: On the intraday chart, #XAUUSD is showing bullish momentum after rebounding from the $4,029 demand zone. Price structure indicates a potential short-term continuation toward the $4,036–$4,048 resistance area. - Trade: The buy setup remains valid above $4,029, targeting $4,036–$4,048. A move below $4,022 invalidates the bullish scenario and may trigger a correction. #GoldAnalysis #ForexSignals
7.5K
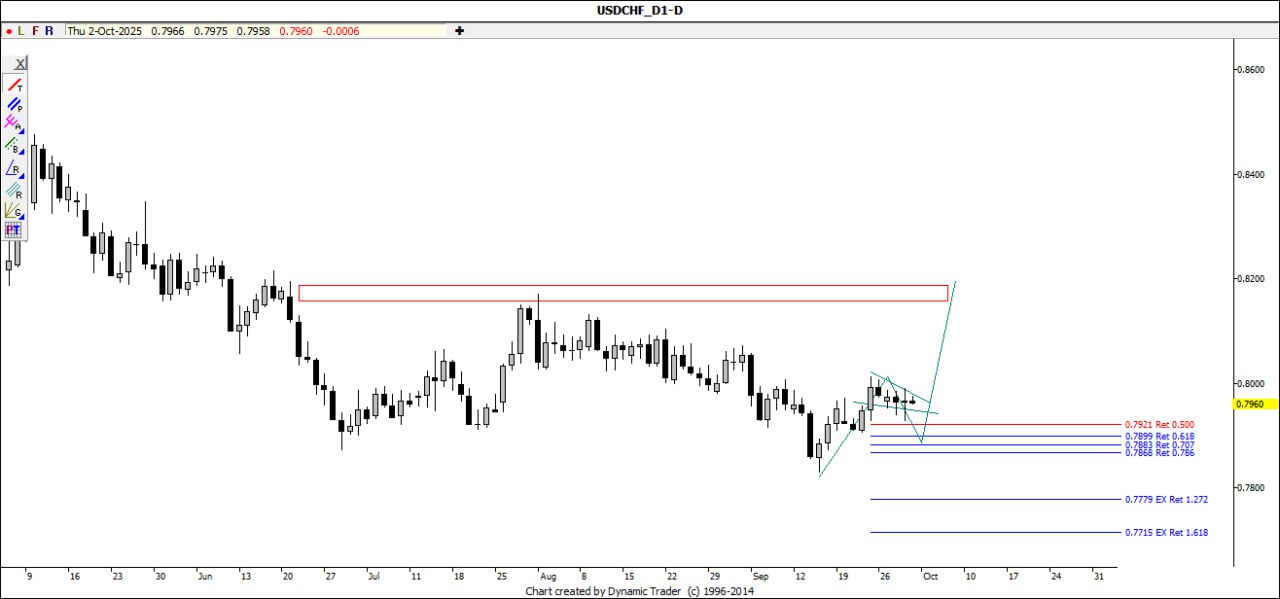
#USDCHF Market Analysis ⚡️ - Technical: On the daily chart, #USDCHF is forming a bullish flag pattern near the 0.7950 zone, suggesting potential continuation after consolidation. The price is holding above key retracement levels (0.7890–0.7920), indicating underlying strength. - Trade: A breakout above 0.8000 could trigger a rally toward 0.8150–0.8250. Failure to hold 0.7890 would invalidate the setup and open the door toward 0.7770.
9.2K
#EURUSD Market Analysis ⚡️ - Technical: On the 4H chart, #EURUSD is showing bullish potential after bouncing from the 1.1727 support zone, aligning with key #Fibonacci retracement levels. Price structure suggests continuation toward higher resistance levels. - Trade: The buy setup remains valid above 1.1727, targeting 1.1814–1.1860. A break below 1.1659 invalidates the bullish bias and signals a potential reversal. #EuroAnalysis #ForexSignals
13.8K
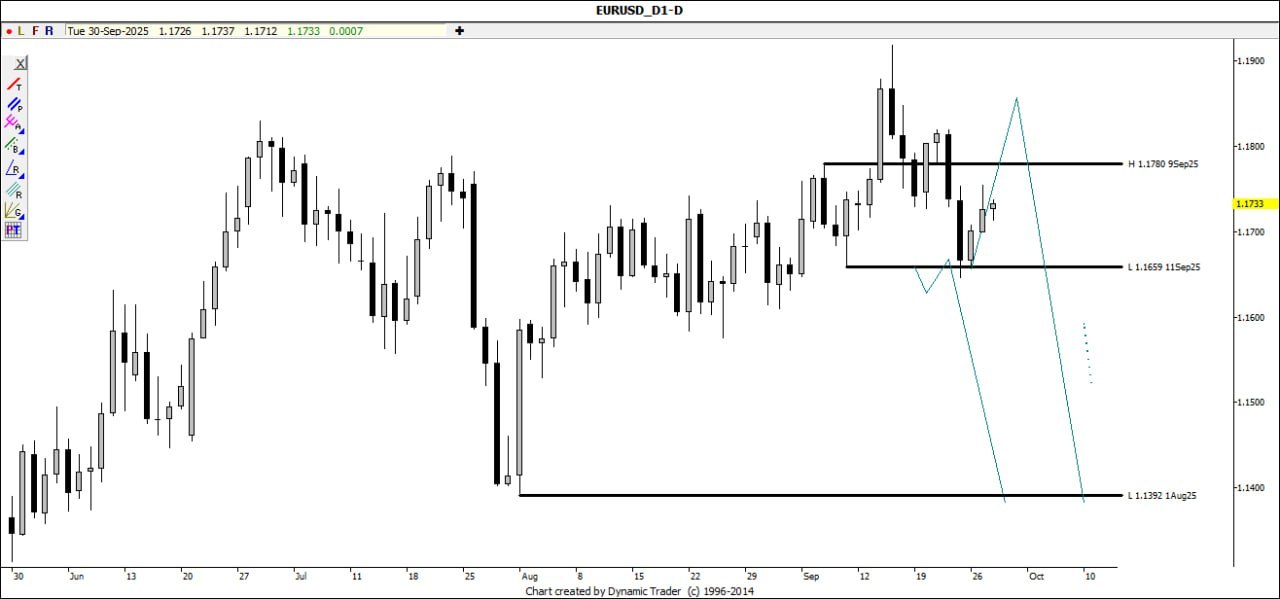
#EURUSD Market Analysis ⚡️ - Technical: On the daily chart, #EURUSD is trading between 1.1650 support and 1.1780 resistance. Recent rejection at support suggests a corrective bounce, but structure favors bearish continuation if resistance holds. - Trade: Bias remains bearish below 1.1780, targeting 1.1650–1.1400. A break above 1.1780 cancels the bearish outlook.
10.4K
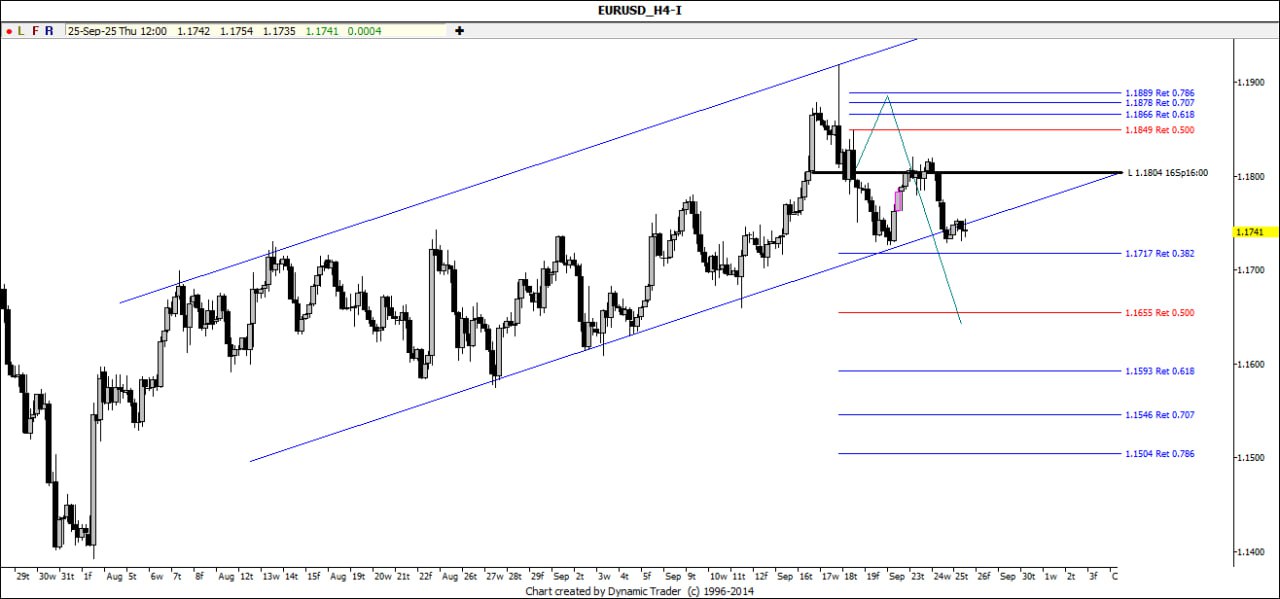
#EURUSD Market Analysis ⚡️ - Technical: On the 4H chart, #EURUSD is displaying bearish pressure from the 1.1804 resistance zone, aligning with #Fibonacci retracement and channel #Resistance. Price structure indicates potential downside continuation as sellers dominate. - Trade: The sell setup remains valid below 1.1804, targeting 1.1717–1.1504. A move above 1.1849 invalidates the bearish outlook and shifts momentum bullish. #EuroAnalysis #ForexSignals
7.5K
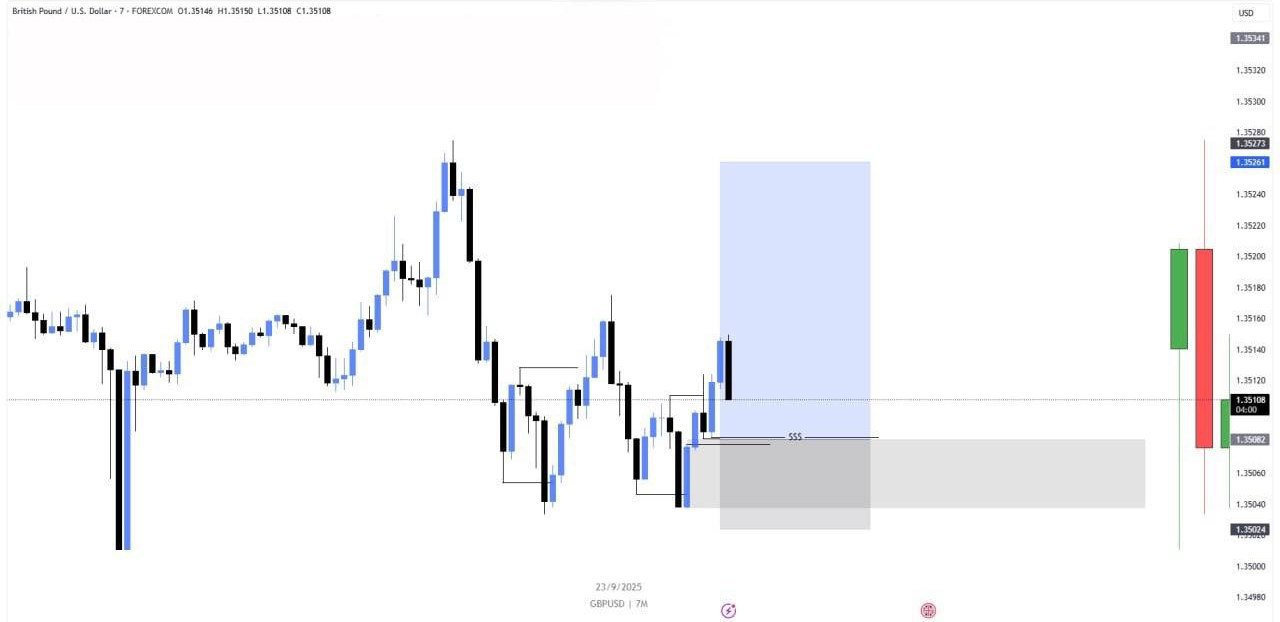
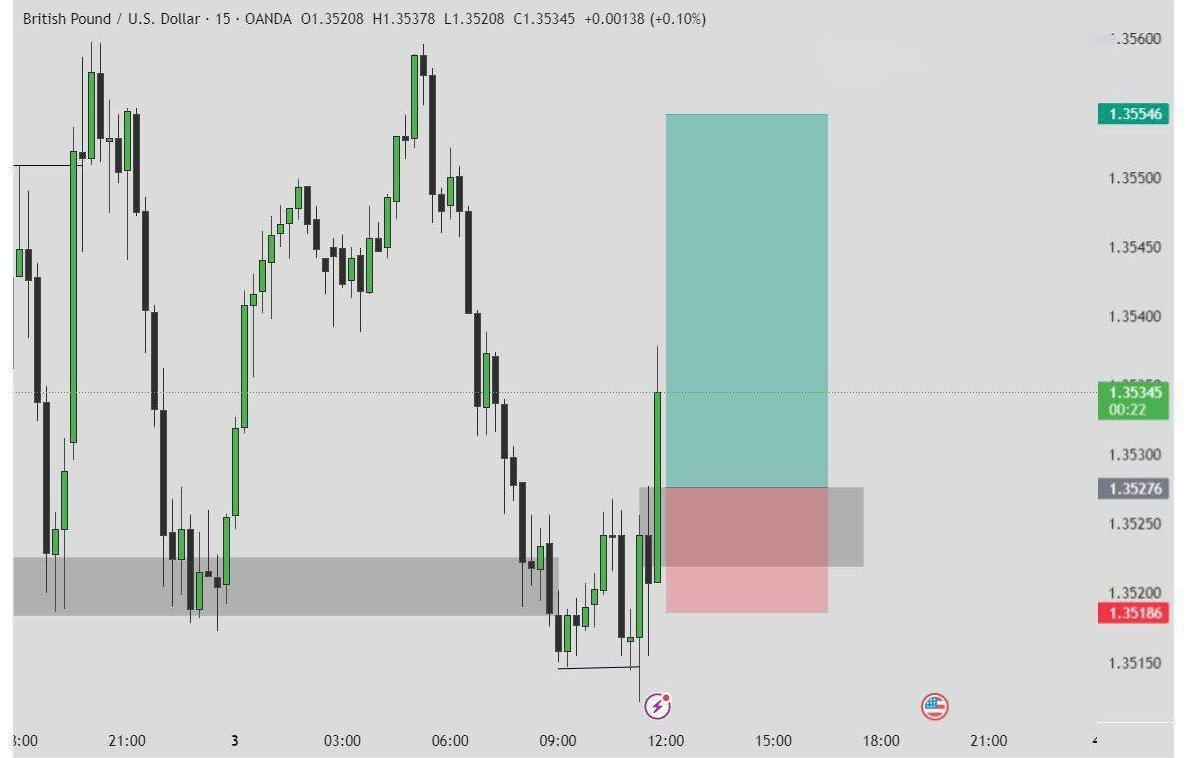
#GBPUSD Quick Trade Setup ⚡️ - Technical: On the 7M chart, #GBPUSD is bouncing from the demand zone near 1.3506–1.3508 and reclaiming 1.3510 as support. Price is showing short-term bullish momentum, eyeing the 1.3527–1.3534 resistance zone. - Trade: Intraday long setup is valid above 1.3508. Continuation targets lie at 1.3527+, while below 1.3502 the setup becomes invalid.
4.6K
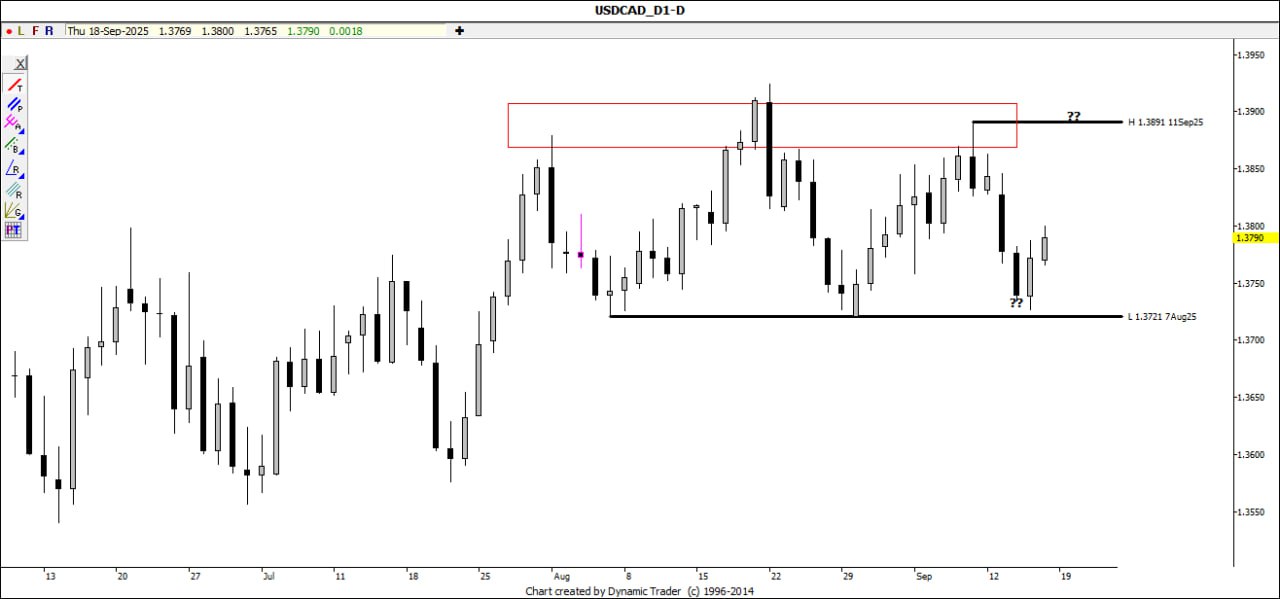
#USD/CAD Market Analysis 📊 - Technical: #USDCAD remains capped below the 1.3890 resistance zone, where repeated failures highlight strong #Supply pressure. Current candles show hesitation after rejection. - Trade: If downside pressure continues, price could revisit the 1.3720 support zone. Only a breakout above 1.3890 would shift bias bullish. Sentiment: Neutral to Bearish.
1.7K
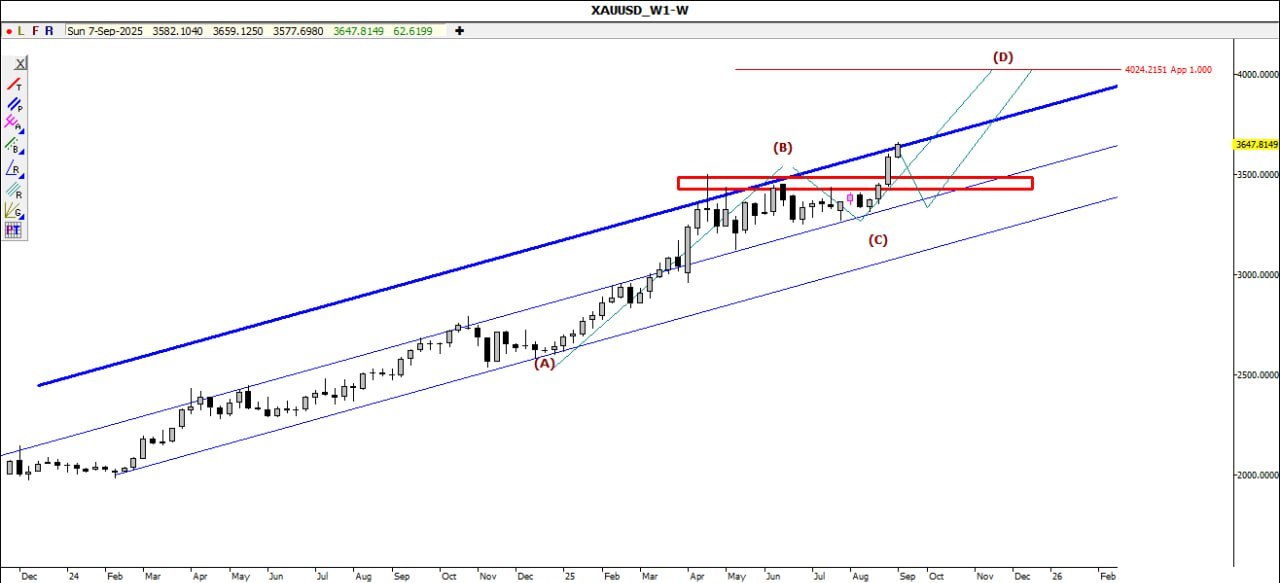
#XAU/USD Market Analysis 📈 - #XAUUSD is trending strongly within an ascending channel, recently breaking above the 3,550–3,600 #Resistance zone and confirming long-term bullish momentum. - Price may extend toward the 4,000 psychological level, with pullbacks likely to retest broken #Support zones before continuation. Sentiment: Bullish.
1.7K
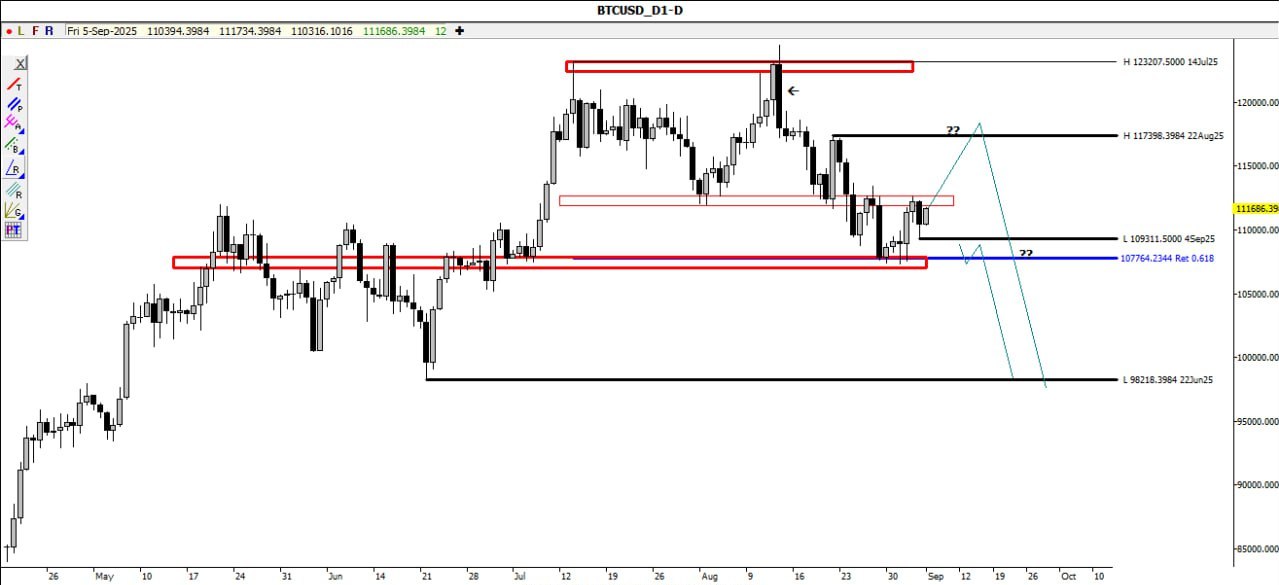
#BTC/USD Market Analysis 📊 - #BTCUSD is trading near the 111,600 zone, recovering from recent lows while testing #Resistance from prior breakdown areas. Price is capped below the 117,400 region. - Failure to clear resistance could lead to a retest of 109,300–107,700 support, with risk of deeper moves toward 98,200. #RSI momentum remains mixed. Sentiment: Neutral to Bearish.
1.6K
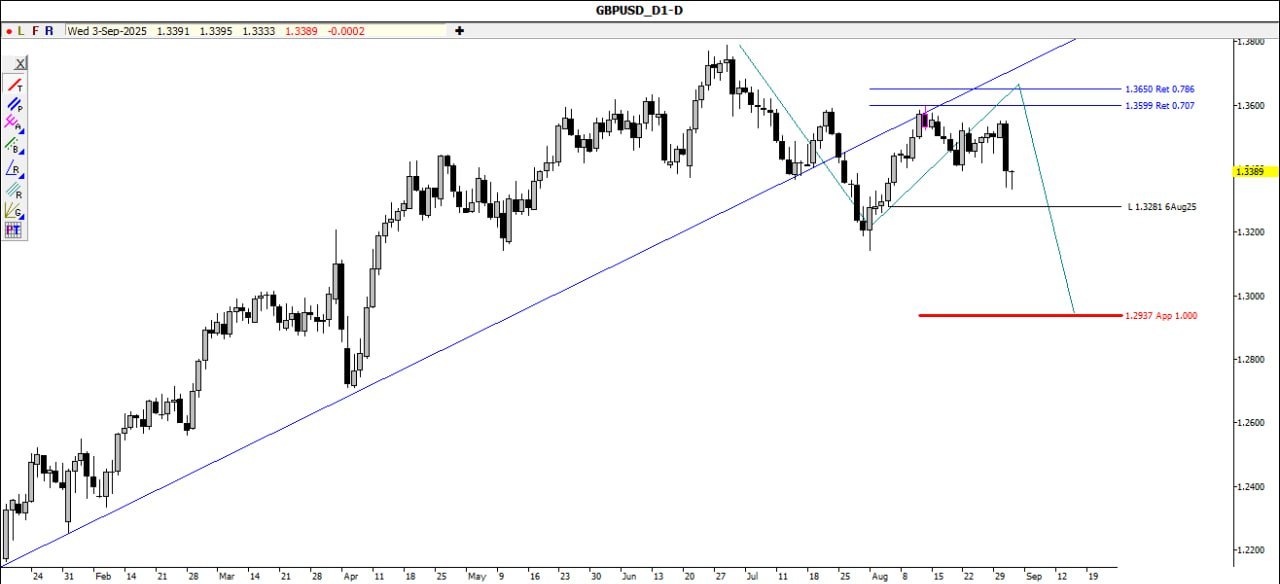
#GBP/USD Market Analysis 💷 - #GBPUSD is forming a bearish wedge pattern after hitting resistance at 1.3391. Key #Support at 1.2937 aligns with the #200DayMovingAverage. - Price may see a pullback toward 1.2937 as #RSI shows overbought signals. Bearish sentiment is gaining traction.
1.6K
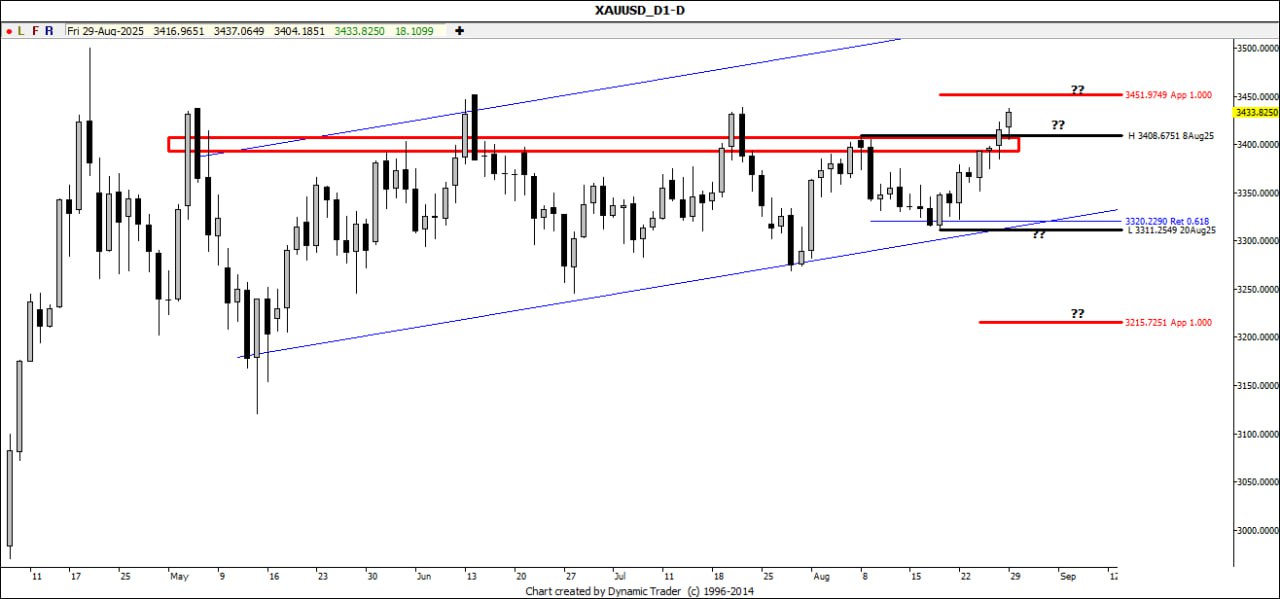
#XAU/USD Market Analysis 📉 - #XAUUSD is testing a rising wedge pattern near 3433.8250. Key #Resistance at 3451.9749 and #Support at 3320.2390 are in focus. - Price action may see a pullback to 3433.8250 with #RSI indicating overbought conditions. Bearish sentiment if 3451.9749 holds.
1.7K
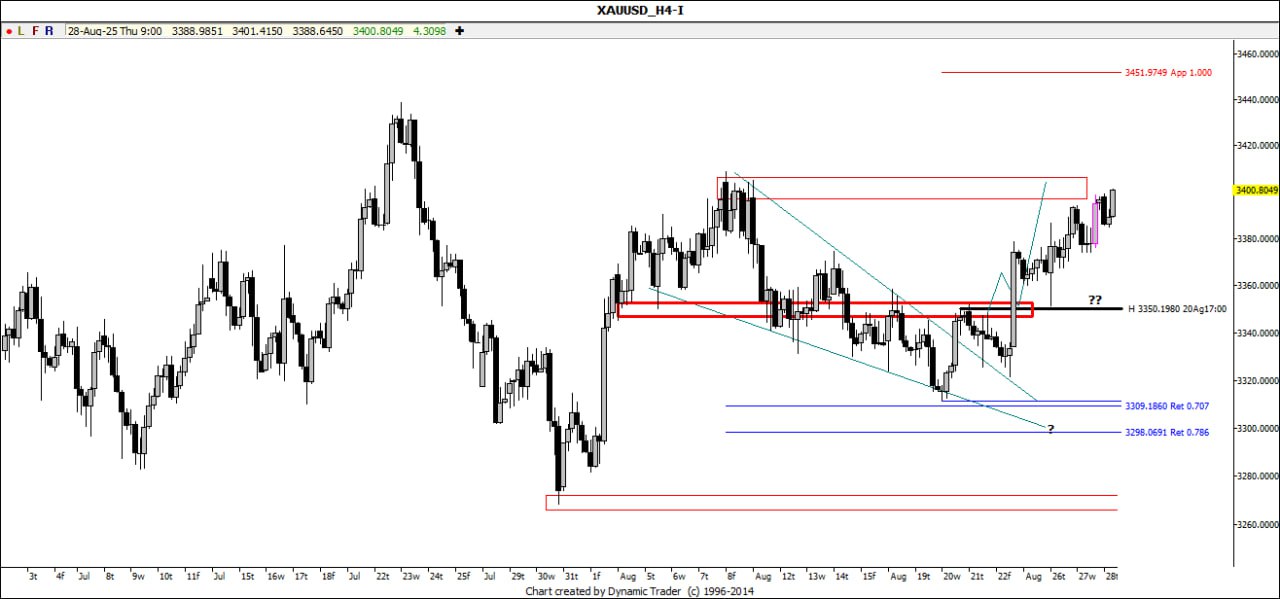
#XAU/USD Market Analysis 📉 - #XAUUSD is forming a bearish wedge pattern after hitting resistance at 3451.9749. Key #Support at 3309.1860 aligns with the #Fibonacci retracement. - Price may see a pullback toward 3309.1860 with #RSI showing overbought conditions. Bearish sentiment dominates.
1.6K
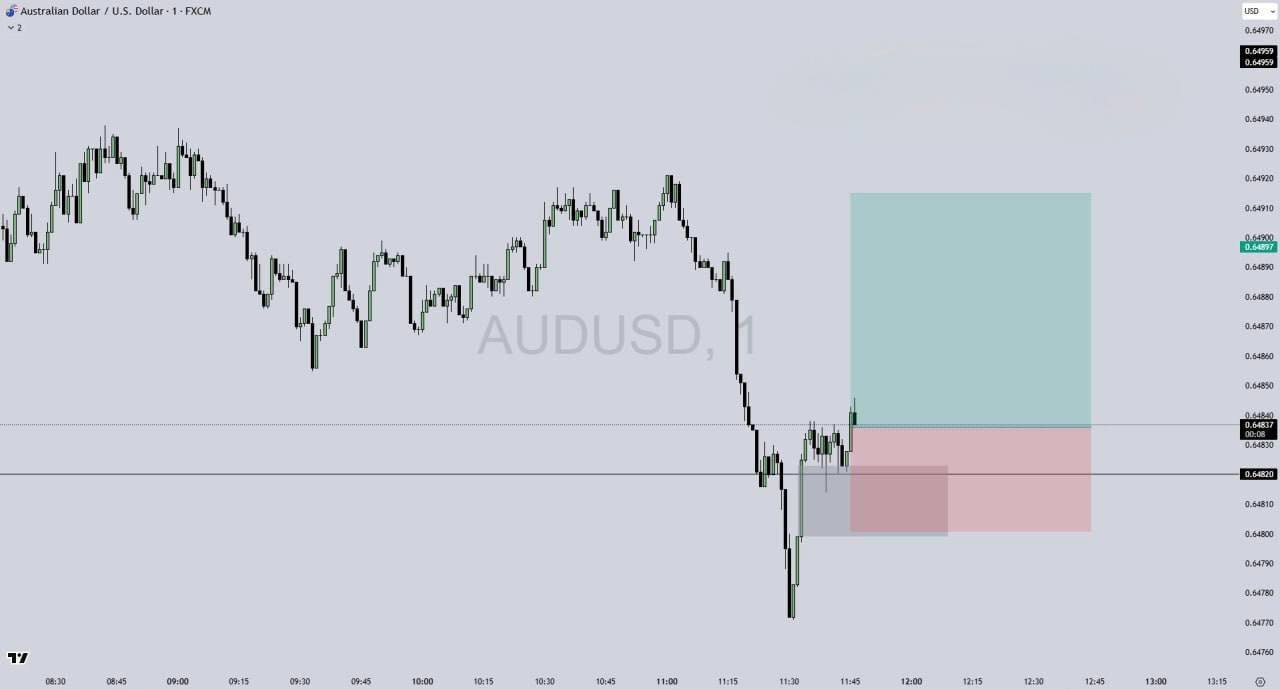
#AUD/USD Market Analysis ⚠️ - Price is consolidating near key resistance with a wedge pattern forming. #RSI shows neutral momentum around 50. - Expecting a breakout attempt but high volatility increases uncertainty. Neutral sentiment until directional clarity emerges.
1.6K
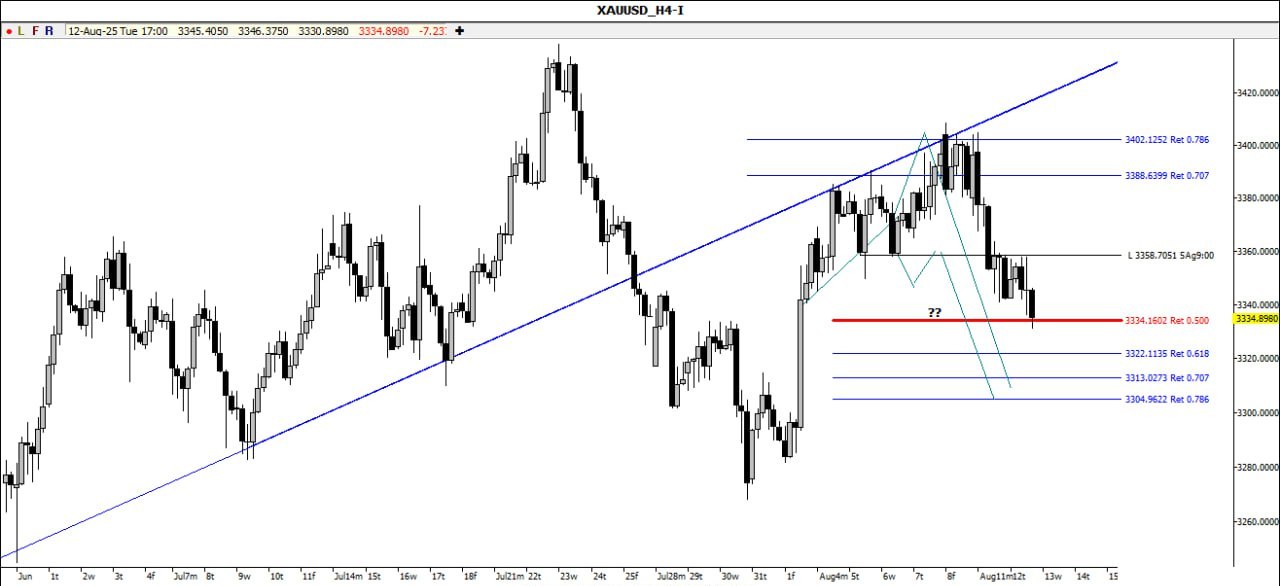
#XAU/USD Market Analysis 📉 - #XAUUSD broke below the ascending #Trendline and is testing 3334 #Support, aligning with the 0.500 #Fibonacci retracement. Price is holding under the 3358 resistance zone. - A continuation towards 3322 and 3313 is possible if selling pressure persists. Sentiment remains bearish while below 3358.
1.7K
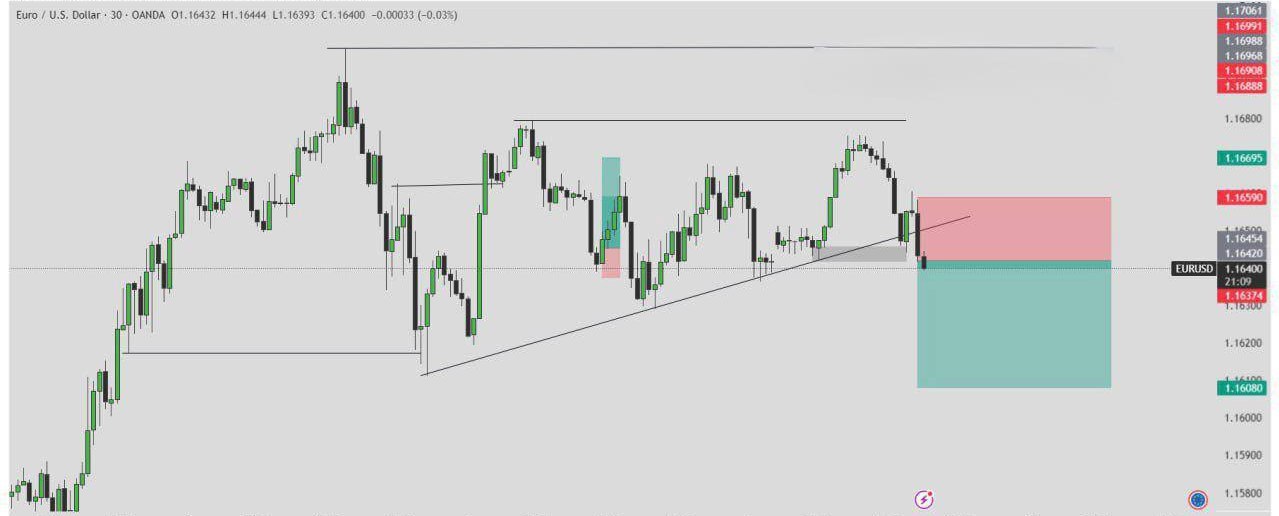
#EUR/USD Market Analysis ⚠️ - #EURUSD has broken below a short-term ascending trendline, signaling possible weakness. Price is trading under the #Resistance zone near 1.16590, showing rejection. - If selling pressure holds, a move toward 1.16080 support could follow. Sentiment is Bearish, but setup remains High Risk.
2K
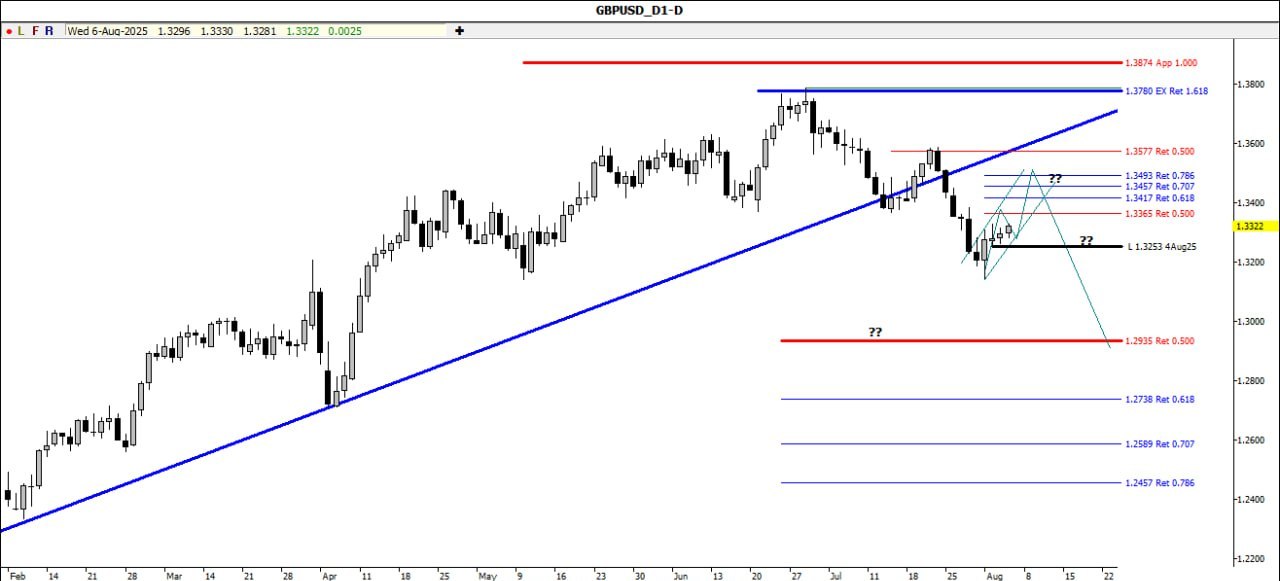
#GBP/USD Market Analysis 💷 - #GBPUSD has broken below a long-term ascending trendline, showing a clear shift in structure. Price is now reacting around the #Fibonacci 0.500 level near 1.3365, facing rejection. - A potential lower high formation may lead to a continuation down toward 1.3253 and possibly 1.2935. Sentiment remains Bearish below resistance.
4.8K
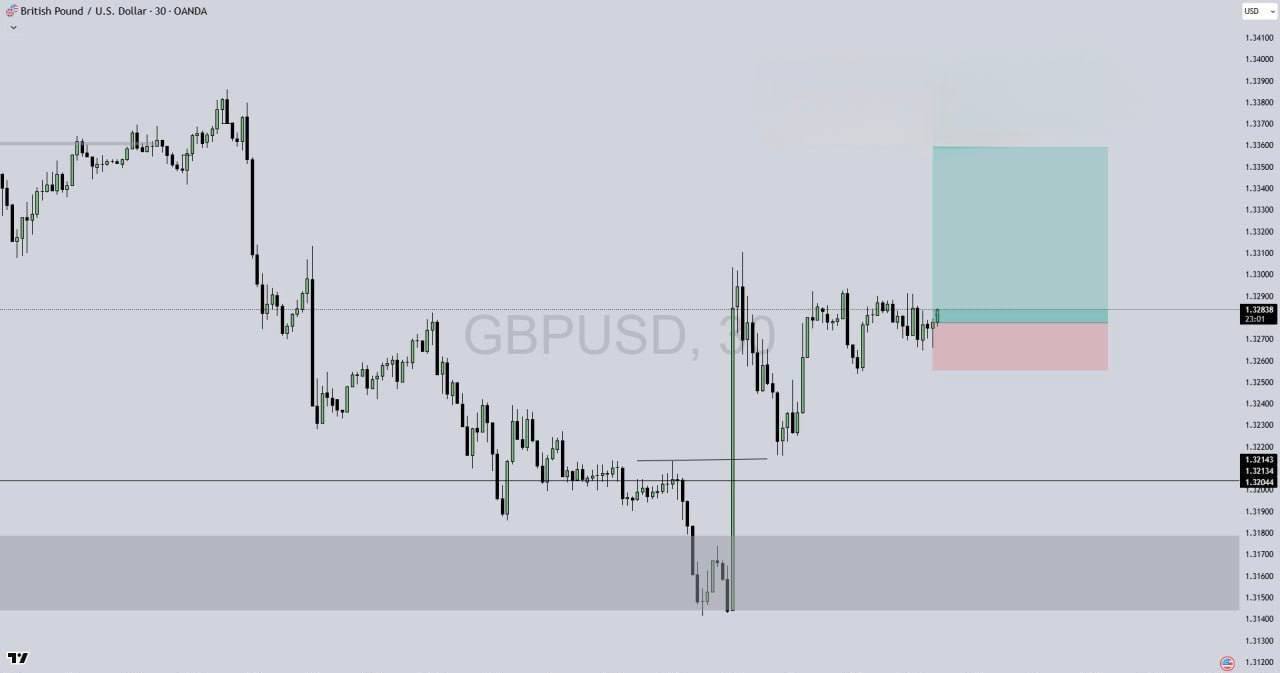
#GBP/USD Market Analysis 📊 - #GBPUSD has broken above short-term resistance, forming a bullish structure on the 30-min chart. Price rebounded strongly from the #DemandZone near 1.2140, indicating buyer interest. - Price is now testing the previous consolidation zone, suggesting a possible bullish continuation. Current momentum and structure keep the sentiment bullish. #ForexAnalysis #PriceAction
6.1K
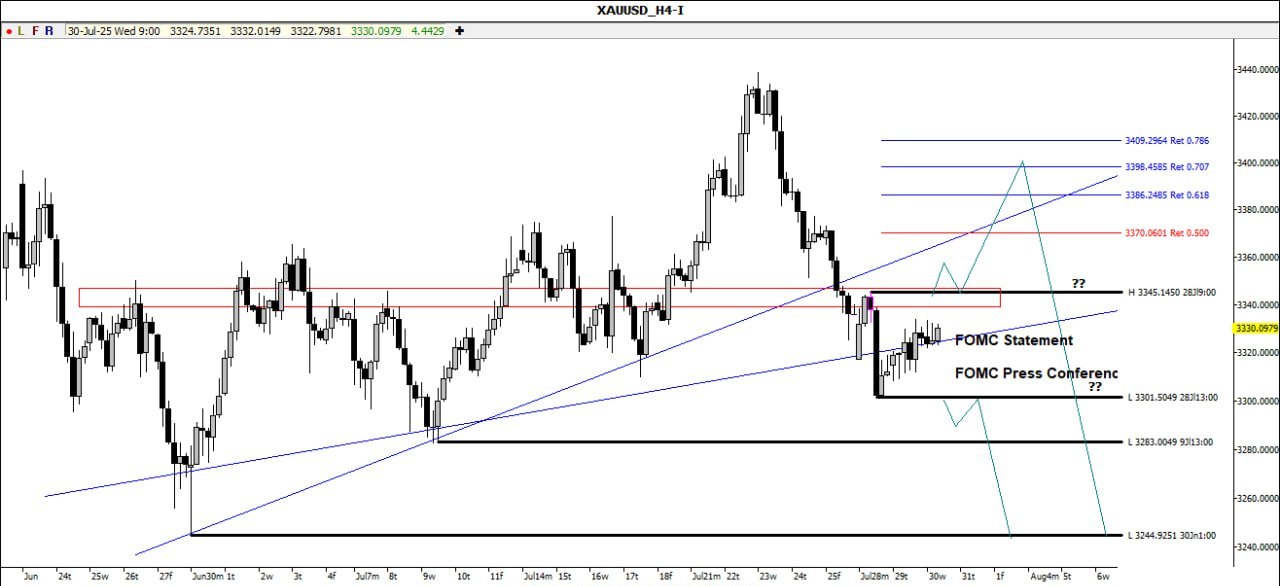
#XAU/USD Market Analysis 📊 - #Gold is consolidating below key resistance at $3345, ahead of the #FOMC statement and press conference. Price is reacting within a tight range after a major breakdown. - Watch for a retest of the supply zone between $3345 – $3370, aligning with #Fibonacci 0.5–0.618 levels. Sentiment remains bearish unless price breaks above this zone.
8.2K
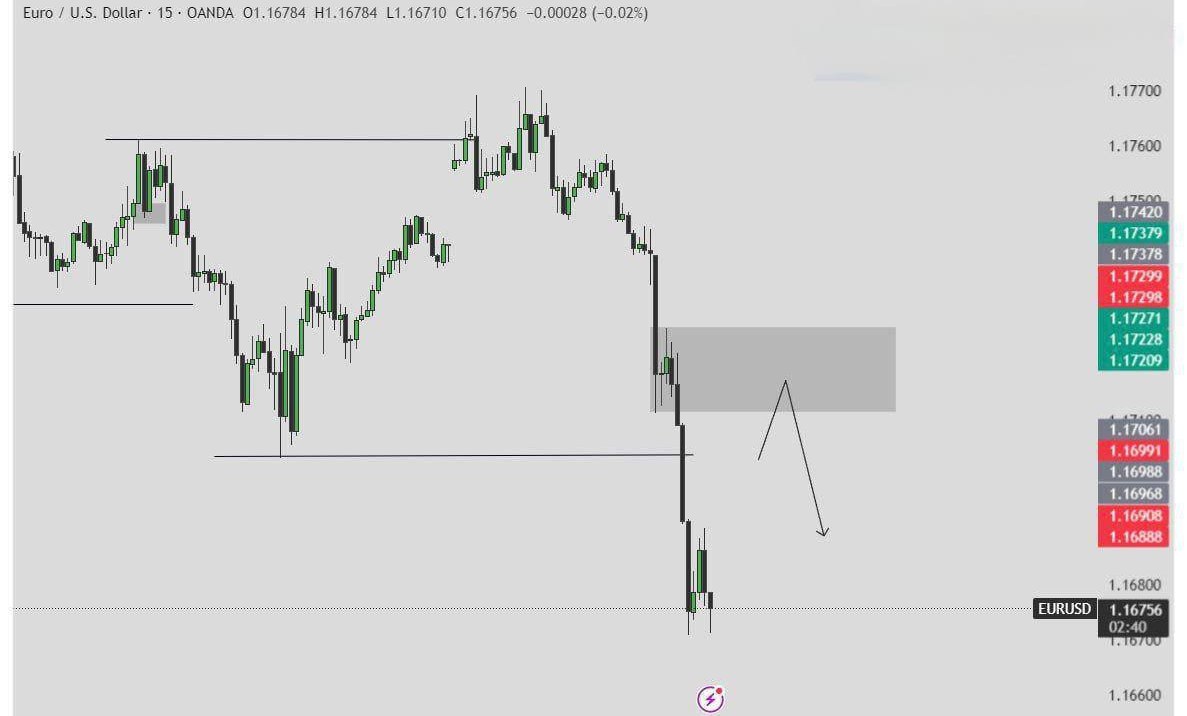
#EUR/USD Market Analysis 📉 - #EURUSD is showing bearish momentum after breaking below key structure. A return to the supply zone near 1.1700 – 1.1728 may trigger a reversal. - Watch for a bearish pin bar or doji at this zone. A break of the low could lead to further downside continuation. #ForexAnalysis #EURUSD
9.9K
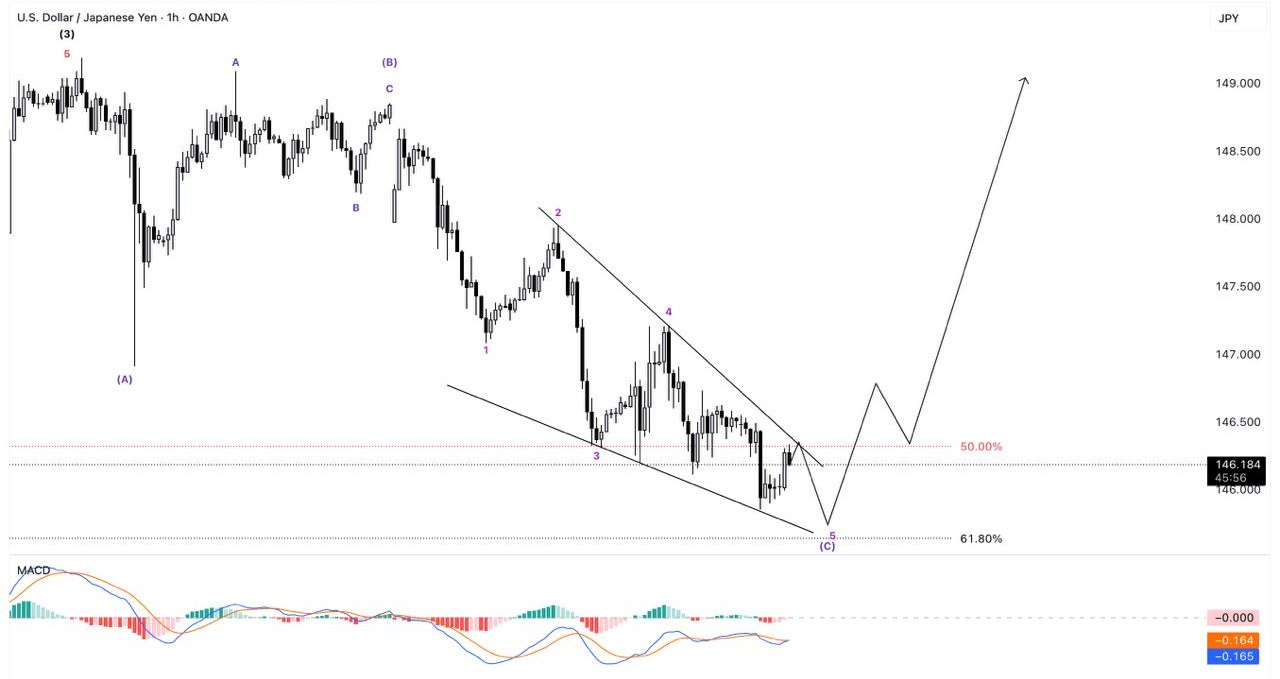
#USD/JPY Market Analysis 🚀 - #USDJPY has completed a 5-wave falling wedge, with a bounce near the 61.80% #Fibonacci retracement, signaling a potential bullish reversal. Price action shows breakout intent. - A push above the 146.500 level may confirm a structure shift, with momentum supported by a strengthening #MACD crossover. Sentiment turning bullish as correction phase nears completion.
6.8K
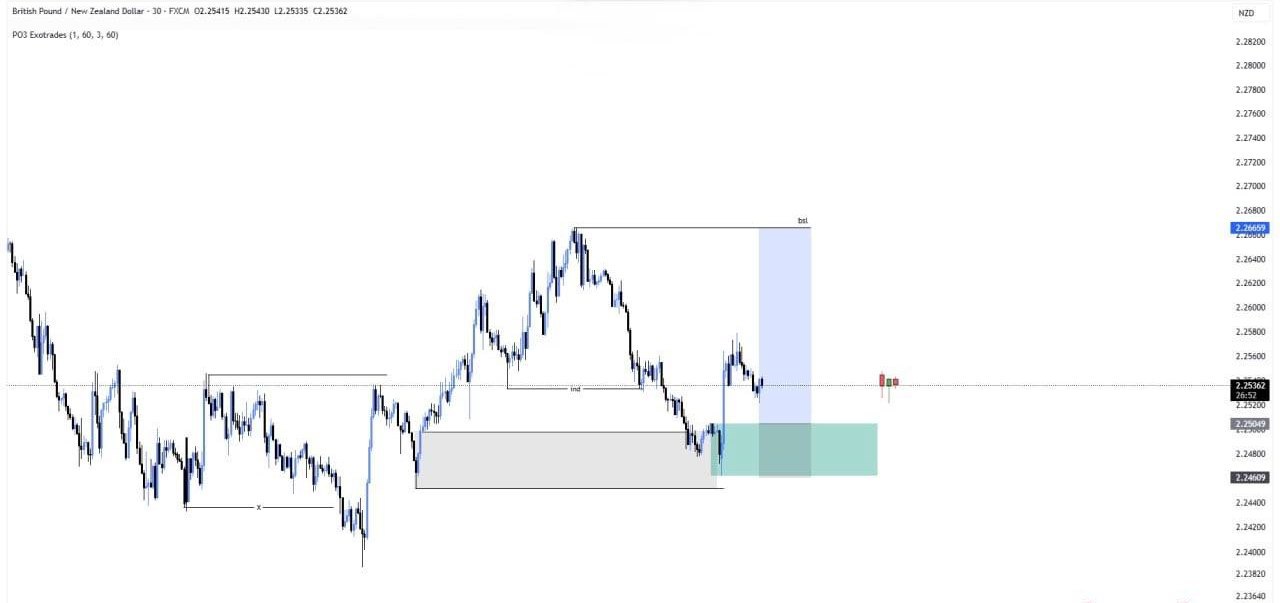
#GBP/NZD Market Analysis 📊 - #GBPNZD is showing bearish momentum after failing to break resistance at 2.26800. Price is testing support at 2.25362, with further support around the 2.24609 level. - Expecting a potential pullback and retest of support. Bearish sentiment remains as long as 2.26800 holds.
4.1K
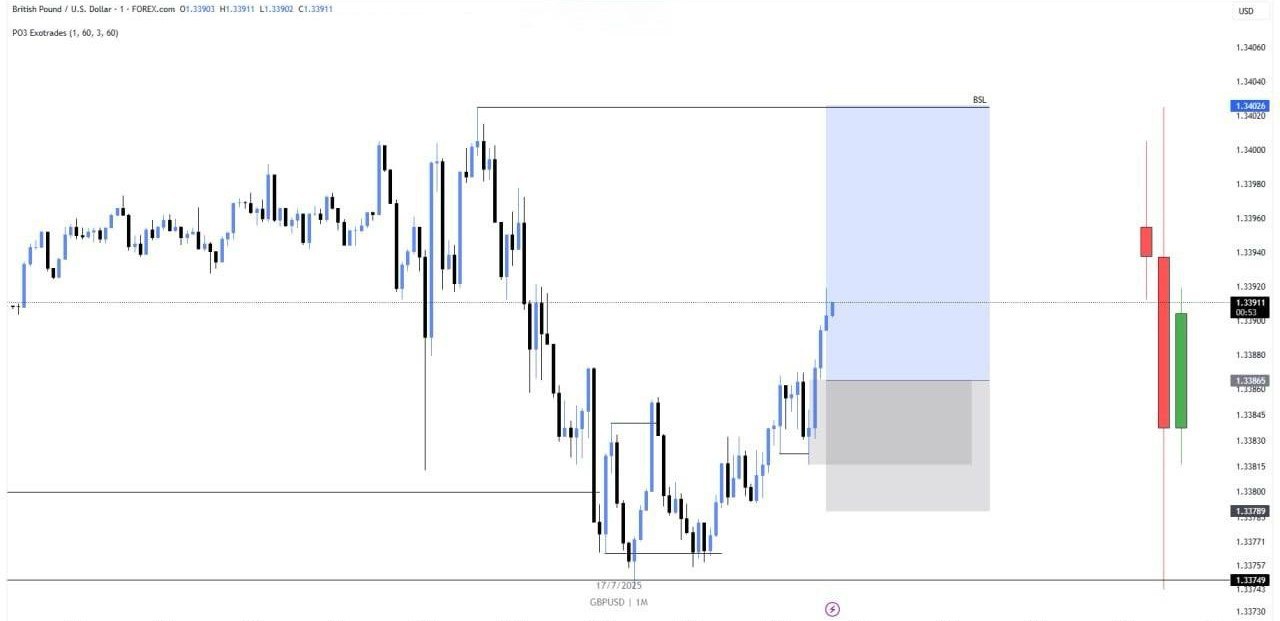
#GBP/USD Market Analysis 💷 - #GBPUSD is retesting a #SupportZone near 1.3386, following a bullish structure. Immediate #Resistance stands at 1.3402, with #Support around 1.3378. - A bounce from support zone could push price toward resistance levels. Bullish sentiment remains valid while holding above 1.3378.
3.8K
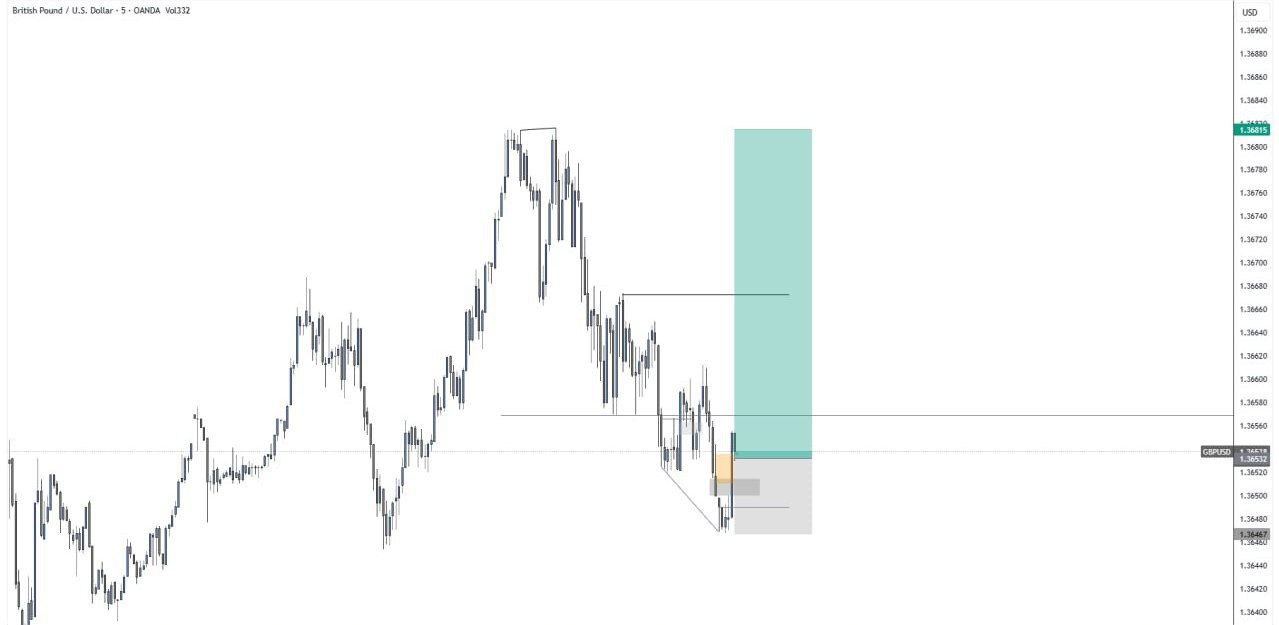
#GBPUSD Market Analysis ⚡️ - Technical: On the intraday chart, #GBPUSD is rebounding from minor support, showing early bullish structure formation. Price is gaining momentum above short-term #Support with room to test higher #Resistance near the 1.36800 zone. - Trade: As long as price stays above intraday support, the bullish bias remains intact, targeting the 1.36800 region. A drop back below support would weaken momentum. #PoundAnalysis #ForexSignals
2.6K
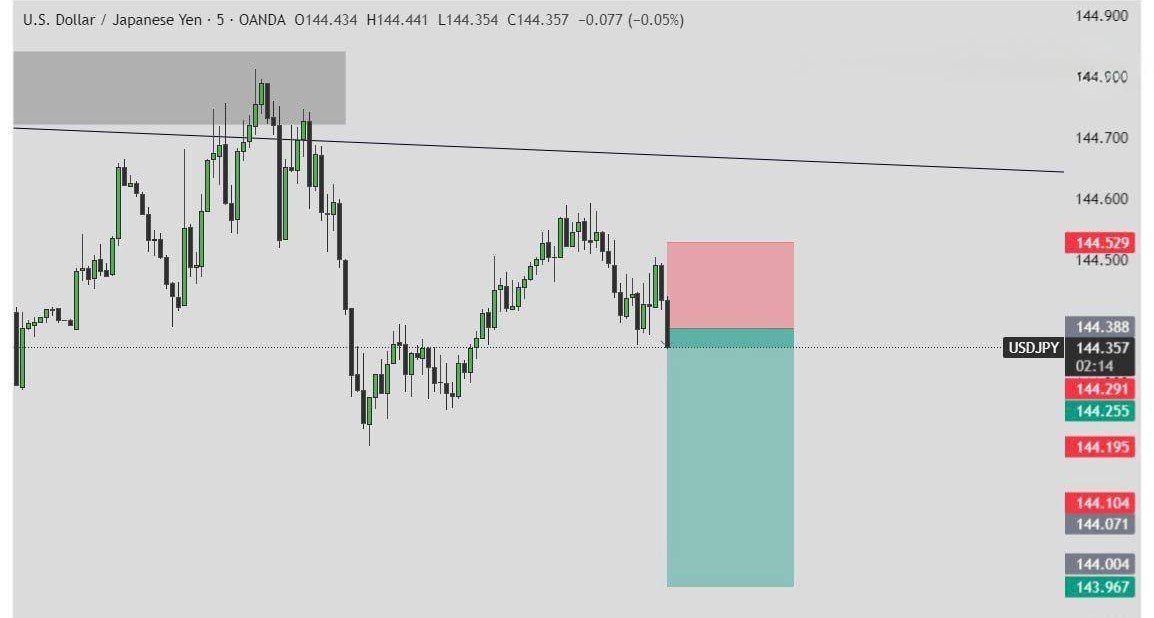
#USDJPY Market Analysis ⚡️ - Technical: On the 5M chart, #USDJPY is forming lower highs, confirming a short-term downtrend. Price is reacting from a key #ResistanceZone, with #PriceAction and momentum both favoring sellers. - Trade: A pullback toward resistance could offer another selling opportunity if it aligns with the short-term #Trend. Sentiment remains bearish while below the resistance zone. #YenAnalysis #ForexSignals
2.3K
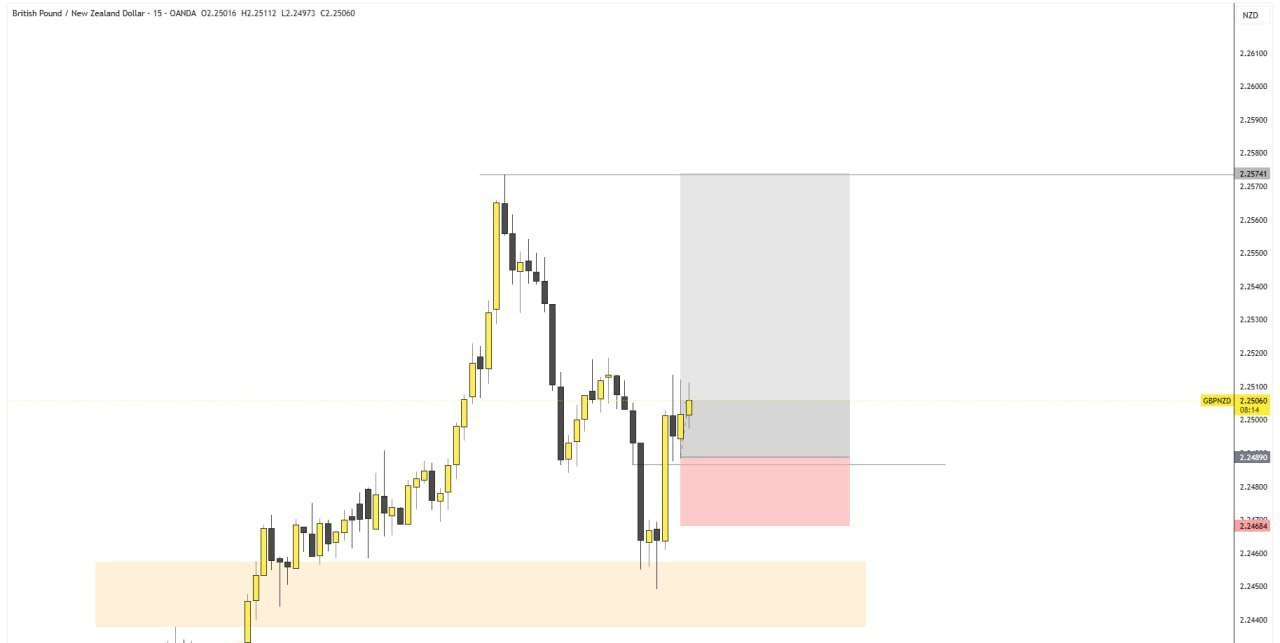
#GBPNZD Market Analysis ⚡️ - Technical: On the 15M chart, #GBPNZD is showing bullish momentum after breaking above resistance and retesting the 2.2505 demand zone. Structure suggests continuation toward higher levels as buyers maintain control. - Trade: The buy setup remains valid above 2.2505, targeting 2.2575. A move below 2.2469 invalidates the bullish outlook and could trigger a pullback. #PoundAnalysis #ForexSignals
2.2K
#GBPUSD Market Analysis ⚡️ - Technical: On the 15M chart, #GBPUSD is nearing a pullback zone, where price may find short-term support. A 5M bullish candle confirmation at this level would signal potential continuation of the uptrend. - Trade: Wait for bullish confirmation before entering. If confirmed, upside momentum could extend toward nearby resistance zones. Maintain caution and follow risk management. #PoundAnalysis #ForexSignals
2K
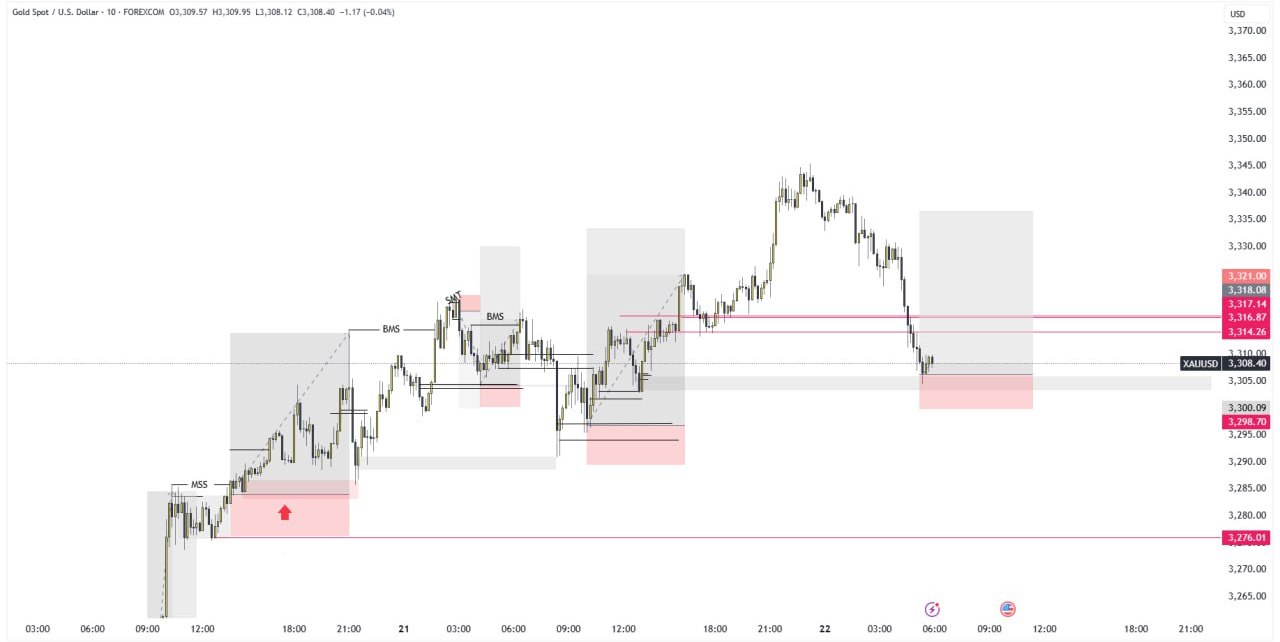
#XAUUSD Market Analysis ⚡️ - Technical: On the 15M chart, #XAUUSD is testing the $3,305 demand zone, showing signs of buyer interest after a corrective move. If this zone holds, price could resume its bullish momentum toward the $3,314–$3,321 resistance area. - Trade: The buy setup remains valid above $3,305, targeting $3,314–$3,321. A drop below $3,276 invalidates the bullish outlook and could trigger a deeper pullback. #GoldAnalysis #ForexSignals
2.5K
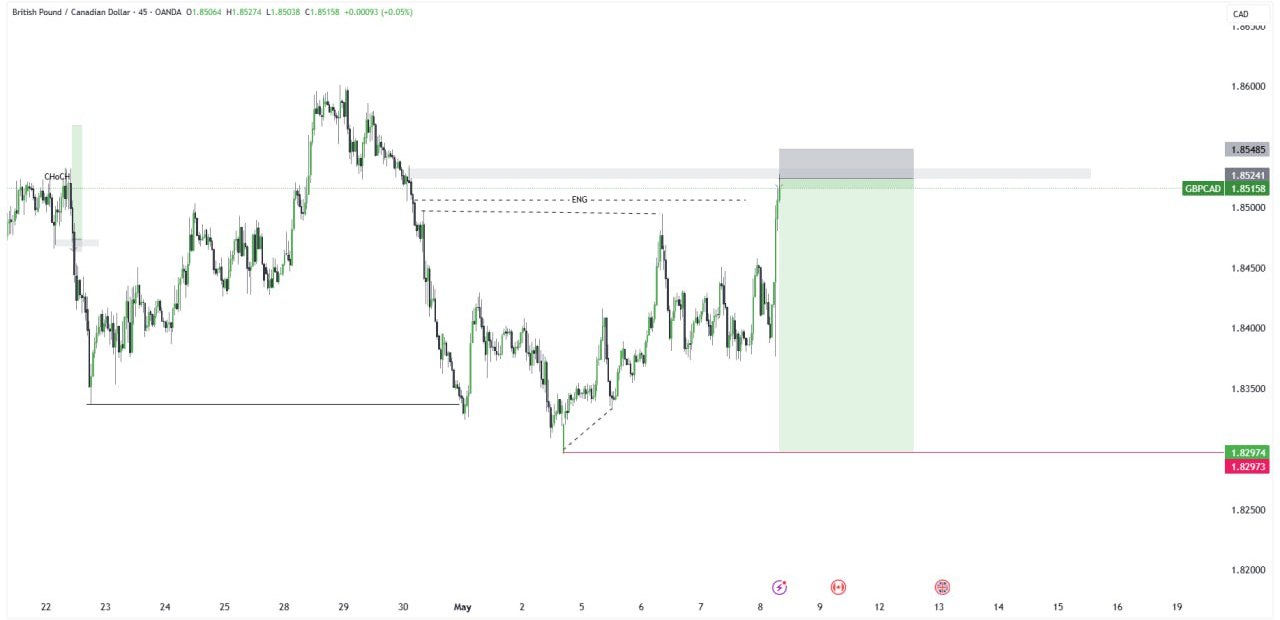
#GBPCAD Market Analysis ⚡️ - Technical: On the 15M chart, #GBPCAD is showing bearish momentum after rejecting the 0.8515 resistance zone. Price structure favors sellers, suggesting a possible continuation toward lower demand levels. - Trade: The sell setup remains valid below 0.85158, targeting 0.84800–0.83500. A break above 0.85530 invalidates the bearish setup and shifts sentiment neutral. #PoundAnalysis #ForexSignals
2K
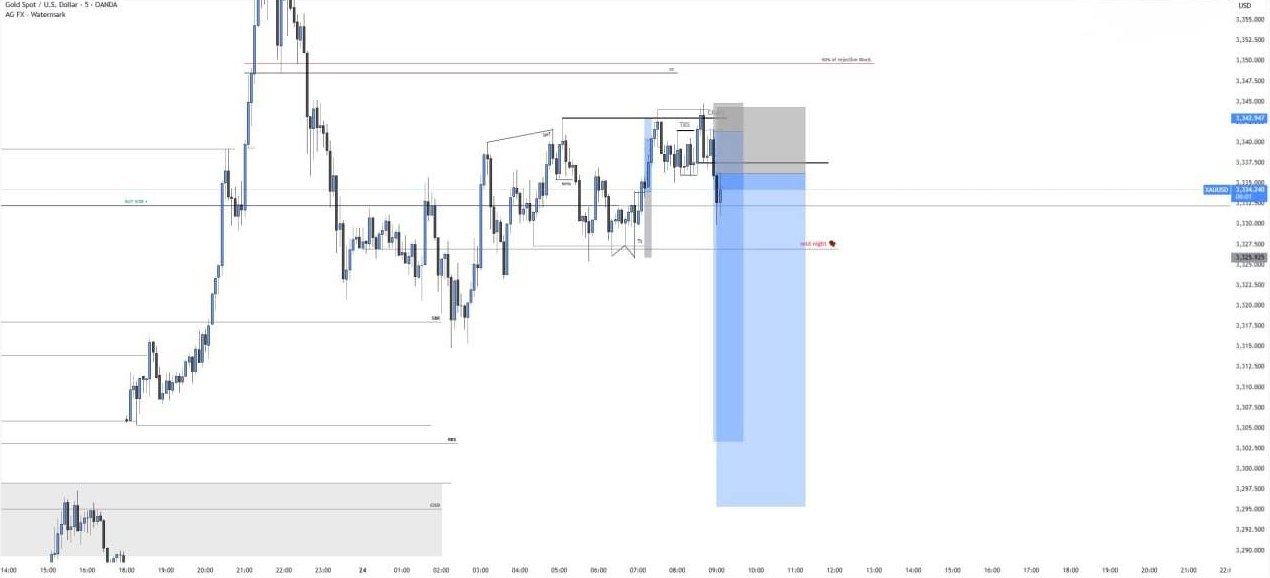
#XAUUSD Market Analysis ⚡️ - Technical: On the 15M chart, #XAUUSD is facing rejection near the $3,335 resistance zone, showing weakening bullish pressure. Price structure suggests a bearish retracement toward lower support levels as sellers regain control. - Trade: The sell setup remains valid below $3,335, targeting $3,323–$3,302. A move above $3,344 invalidates the bearish outlook and could trigger a reversal. #GoldAnalysis #ForexSignals
2K
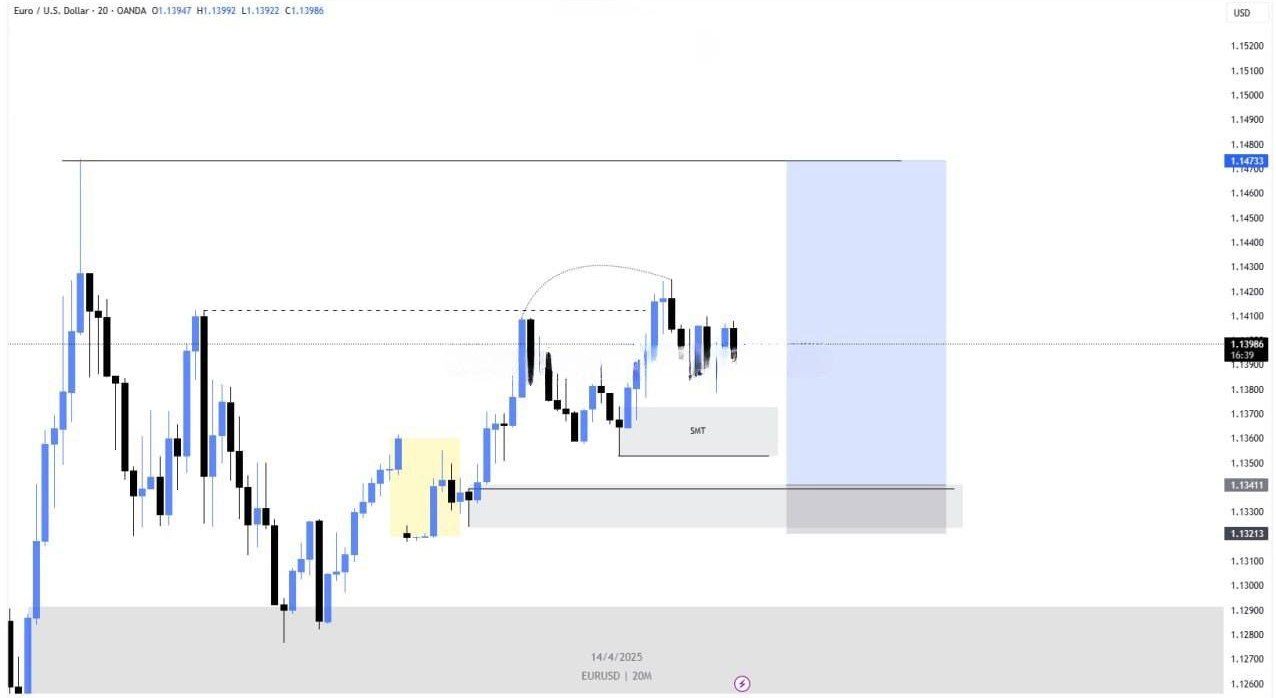
#EURUSD Market Analysis ⚡️ - Technical: On the 15M chart, #EURUSD is rebounding from the 1.1342 demand zone, showing signs of bullish momentum after testing a key support level. Structure suggests potential continuation toward the 1.1390–1.1470 resistance area. - Trade: The buy setup remains valid above 1.1342, targeting 1.1390–1.1470. A drop below 1.1320 invalidates the bullish scenario and could trigger short-term selling pressure. #EuroAnalysis #ForexSignals
2.1K
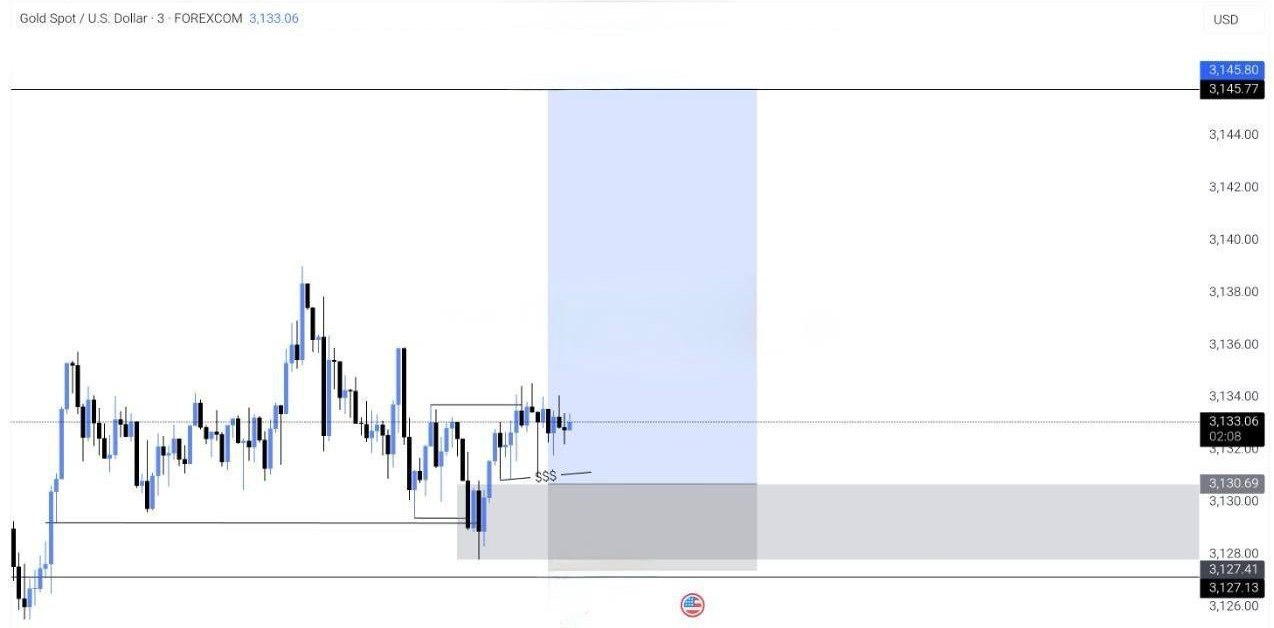
#XAUUSD Market Analysis ⚡️ - Technical: On the 15M chart, #XAUUSD is reacting from the $3,130 demand zone, where buyers are showing early signs of strength. Price structure indicates a potential short-term bullish rebound toward the $3,138–$3,145 resistance area. - Trade: The buy setup remains valid above $3,130.7, targeting $3,138–$3,145. A move below $3,127.5 invalidates the bullish outlook and may trigger short-term downside pressure. #GoldAnalysis #ForexSignals
1.7K

Listing Statistics
8
10 hours ago
SeBuDA
Recently our headquarters moved from USA to Netherland so we could make more features for our users, we sure that our users can feel the changes in the future and this decision is for sake of our users
Netherland
Sebuda B.V.
CoC Number: 95490469
Zuid-Hollandlaan 7, 2596AL ‘s-Gravenhage
The Hauge, The Netherlands
(+31)0687365374
Be with us on Social Networks
Social media accounts for sale
Help and Services
© 2022 SeBuDA.com, All rights reserved.